
Gold, S&P 500, Nasdaq, USD Talking Points:
- It’s been continued recovery over the past week after the panic-prone push a couple of weeks ago. It was positive U.S. data last week that helped the recovery along and this puts focus on tomorrow’s U.S. CPI report.
- Gold also has had a bid on the back of geopolitical risk given events in the Middle East and that remains notable. But the big question is if bulls can barge through and hold a breakout over the $2,500 psychological level.
- This is an archived webinar and you’re welcome to join the next one: Click here to register.
The S&P 500 has continued the recovery theme and it’s been a brisk pace since last Thursday, when prices were grinding in a higher-low. The driver from last Thursday was a positive report on US jobless claims, which helped to offset some of the fear from the abysmal NFP report from the prior Friday.
That ‘positive’ U.S. data saw another iteration this morning with PPI printing near the expectation, further providing evidence that the U.S. economy wasn’t on the verge of a fast slowdown. But, that remains of issue as we near tomorrow’s CPI report and the sell-offs that we saw gave glimpse of what may happen in that negative scenario.
Namely, a rush into Treasuries to capture yield before the Fed goes into rate cuts could draw capital from a number of risk markets. It’s the degree to which those cuts come in that will determine how aggressively that might show, and for investors, it’s the data prints that will highlight how aggressive the Fed may be.
If we do see that surge in Treasury prices (and lower USD yields), capital can draw from a number of markets, gold included, such as we saw last Monday when panic had peaked. Gold soon found a higher-low as looked at in last week’s webinar and buyers have since went to work to push back towards recently-established all-time-highs.
The challenge with gold at the moment is proximity to $2,500, which is a major psychological level, similar to the $2k level that held the highs for more than three years until buyers could finally back a breakout. That breakout hasn’t pulled back very much, leading to overbought RSI readings on the monthly chart. There’s now a possibility of a bid on the back of geopolitical risk but similar to how gold held $2k when Russia invaded Ukraine, there’s technical structure to consider in those scenarios. I went over a series of levels and scenarios for gold in the webinar, as this dominated almost the first twenty minutes of the session.
Spot Gold (XAU/USD) Four-Hour Price Chart
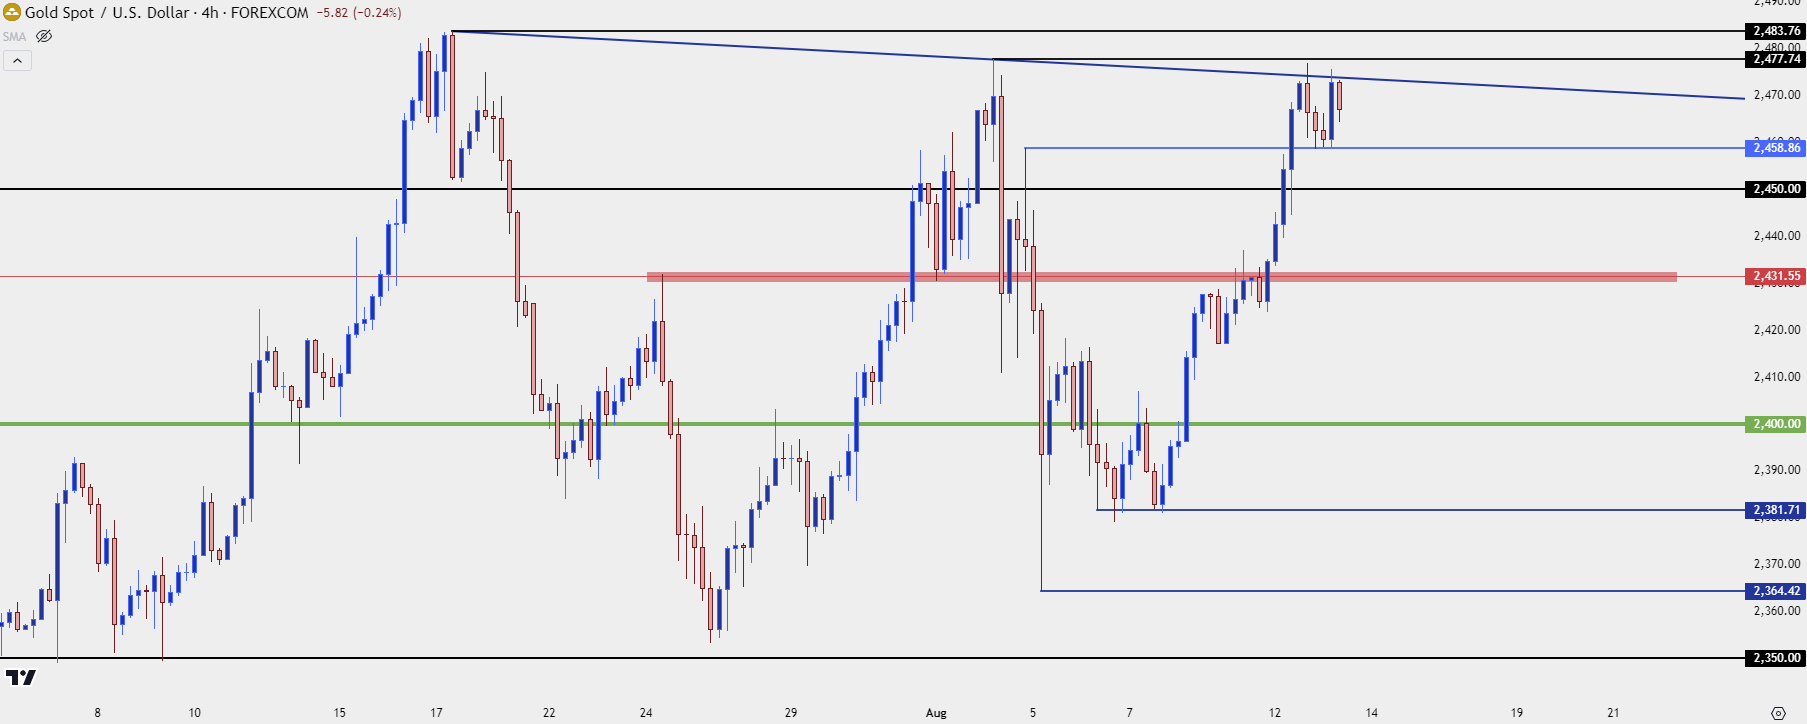 Chart prepared by James Stanley; data derived from Tradingview
Equity Rally
As that rush for Treasuries was taking place a lot of capital was leaving equities. Timing for rate cuts remains important, especially if we see a hurried Fed cut rates by 125 bps by the end of the year. So, paradoxically, we may be in a mode where significant softness in inflation brings on more selling in stocks, as that would also suggest a firmer case for more rate cuts from the Fed, which could drive flows into Treasuries.
That panic has taken a backseat over the past week, however, and at this point, the S&P 500 is stretching to fresh highs after having erased the entirety of the NFP sell-off from two weeks prior. My next resistance level is at 5481, but it’s the 5,500 level that looms large overhead.
S&P 500 Futures Two-Hour Price Chart
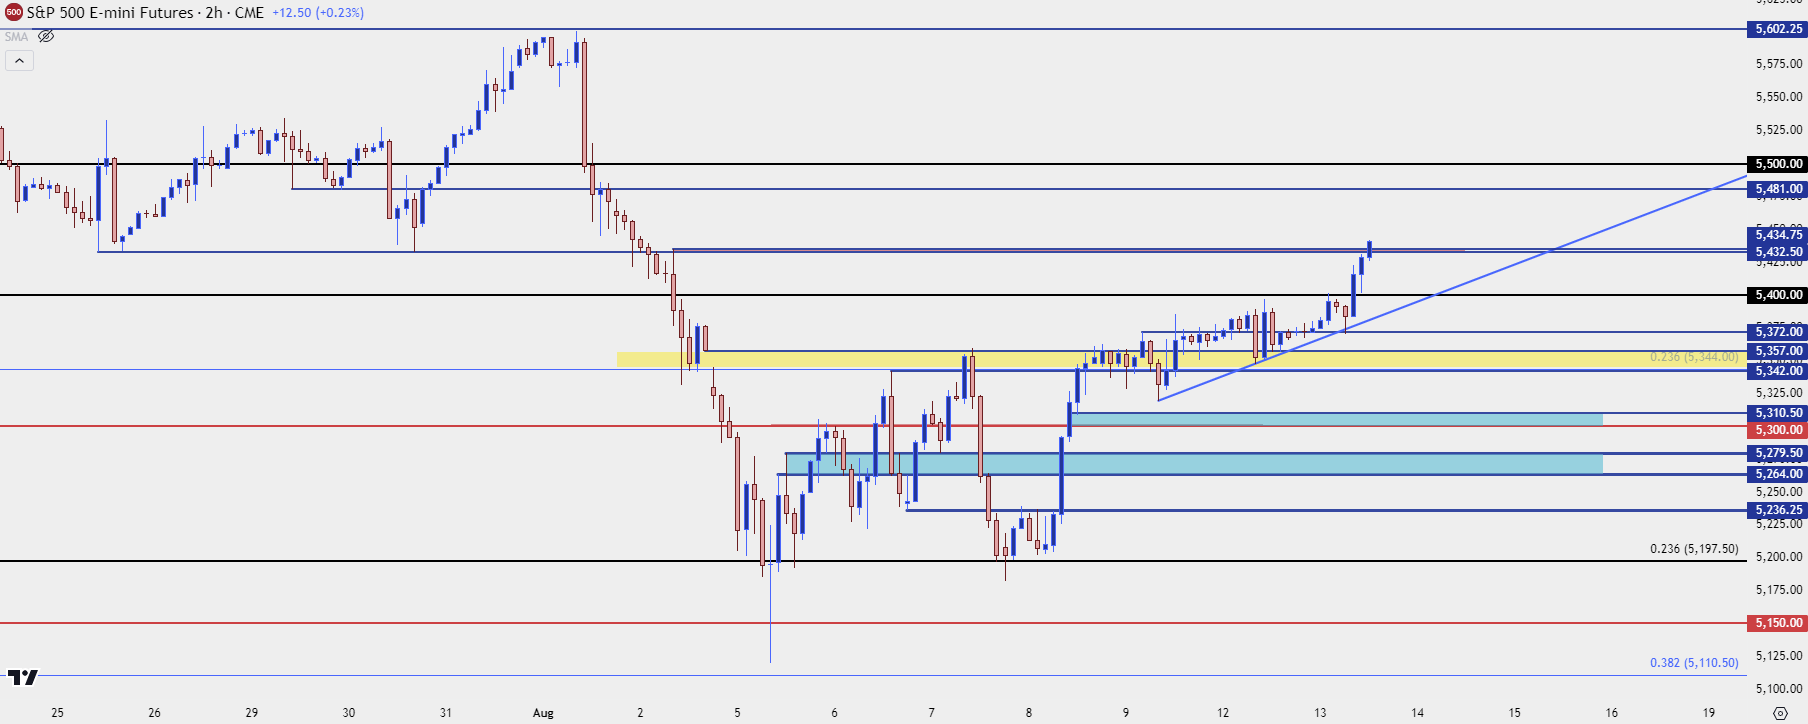 Chart prepared by James Stanley; data derived from Tradingview
Nasdaq
With the recovery trade taking on more prominence, the Nasdaq is showing a bit more aggression than the S&P 500 looked at above. At this point I have price breaking-out above a bearish trendline, and the next spot of resistance is a confluent area around the 50% mark of the recent sell-off. This plots from 19,146-19,167.
Nasdaq 100 Four-Hour Price Chart
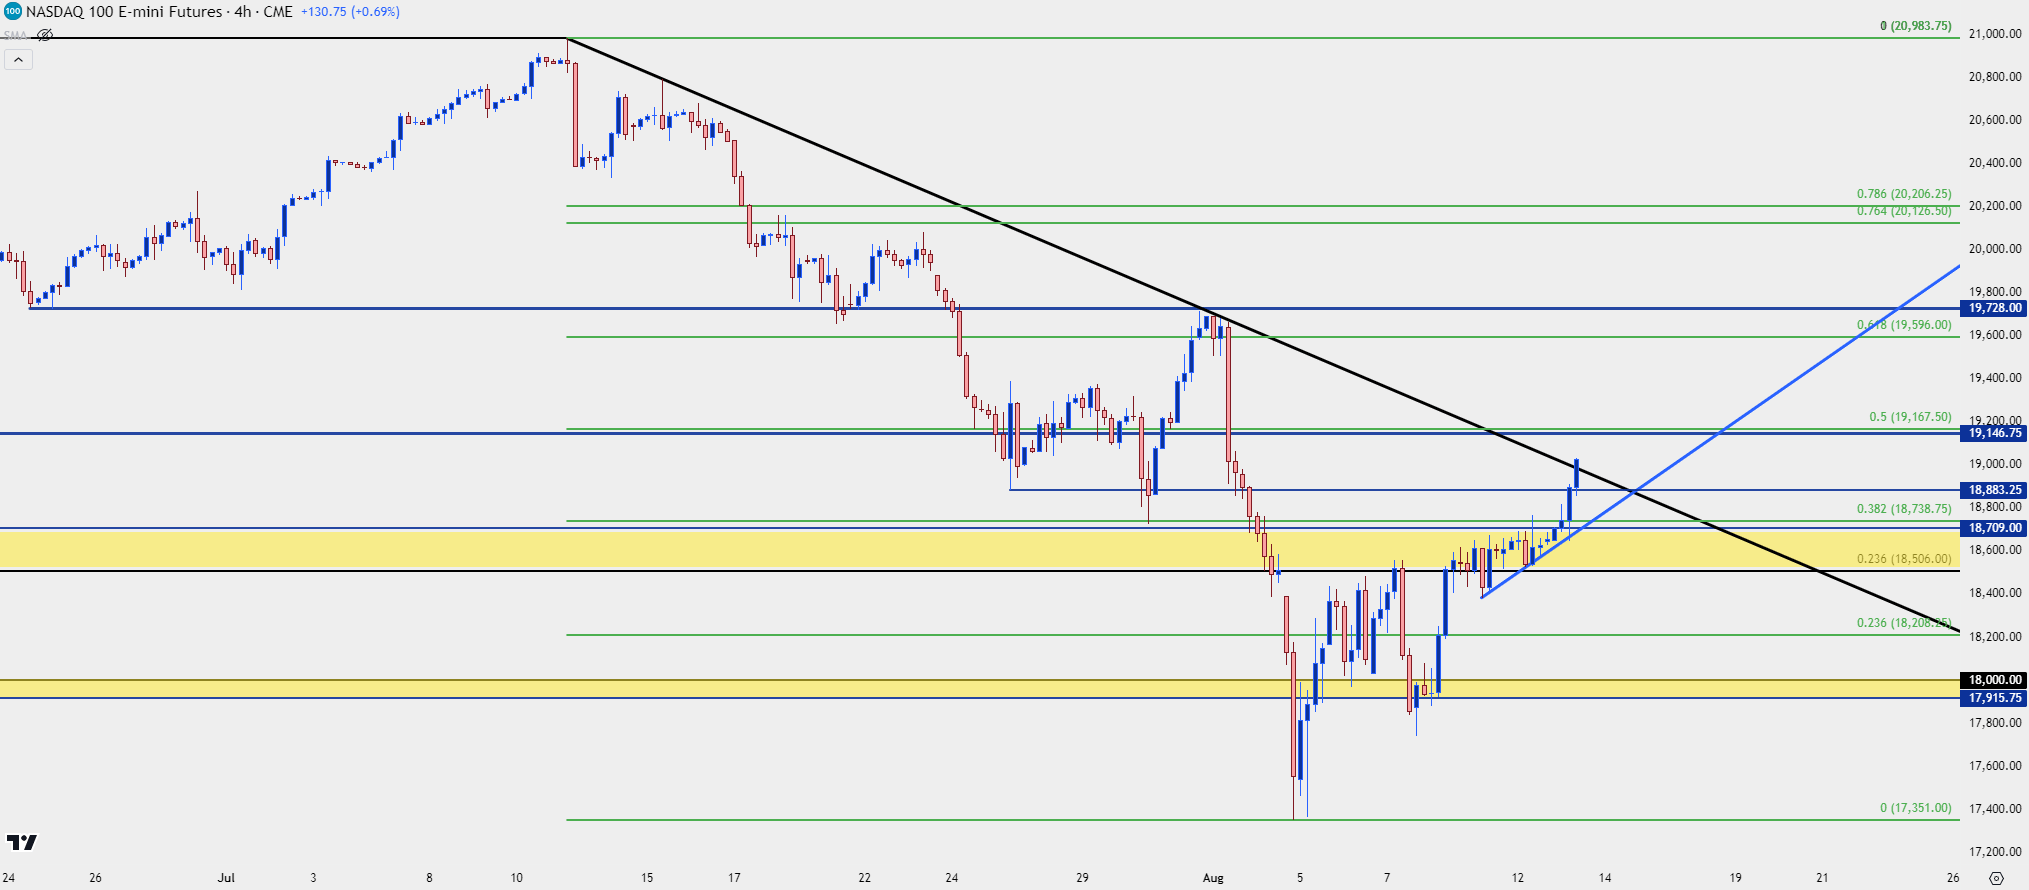 Chart prepared by James Stanley; data derived from Tradingview
US Dollar
I had looked into EUR/USD and in the video I included the US Dollar, as well.
As we had that panic move pricing-in, the US Dollar showed a dramatic sell-off to set a fresh seven-month-low. That low printed right at the 50% mark of the May 2021-September 2022 Fibonacci retracement, which then brought a bounce.
The bounce from that held resistance at the underside of the trendline taken from that May 2021 low, connected to the December 2023 swing low. There’s also the 38.2% Fibonacci retracement of the Oct-December move nearby.
That spot has held the highs in DXY for more than a week and sellers are going back in for another push-lower. As shared in the webinar, I’m trepidatious of chasing this and am now looking to a couple of different spots for a possible higher-low, and the next setup in EUR/USD is another reason as to why. The levels in DXY at 102.66 and then 102.36 remain of note for that higher-low support potential.
US Dollar Daily Price Chart
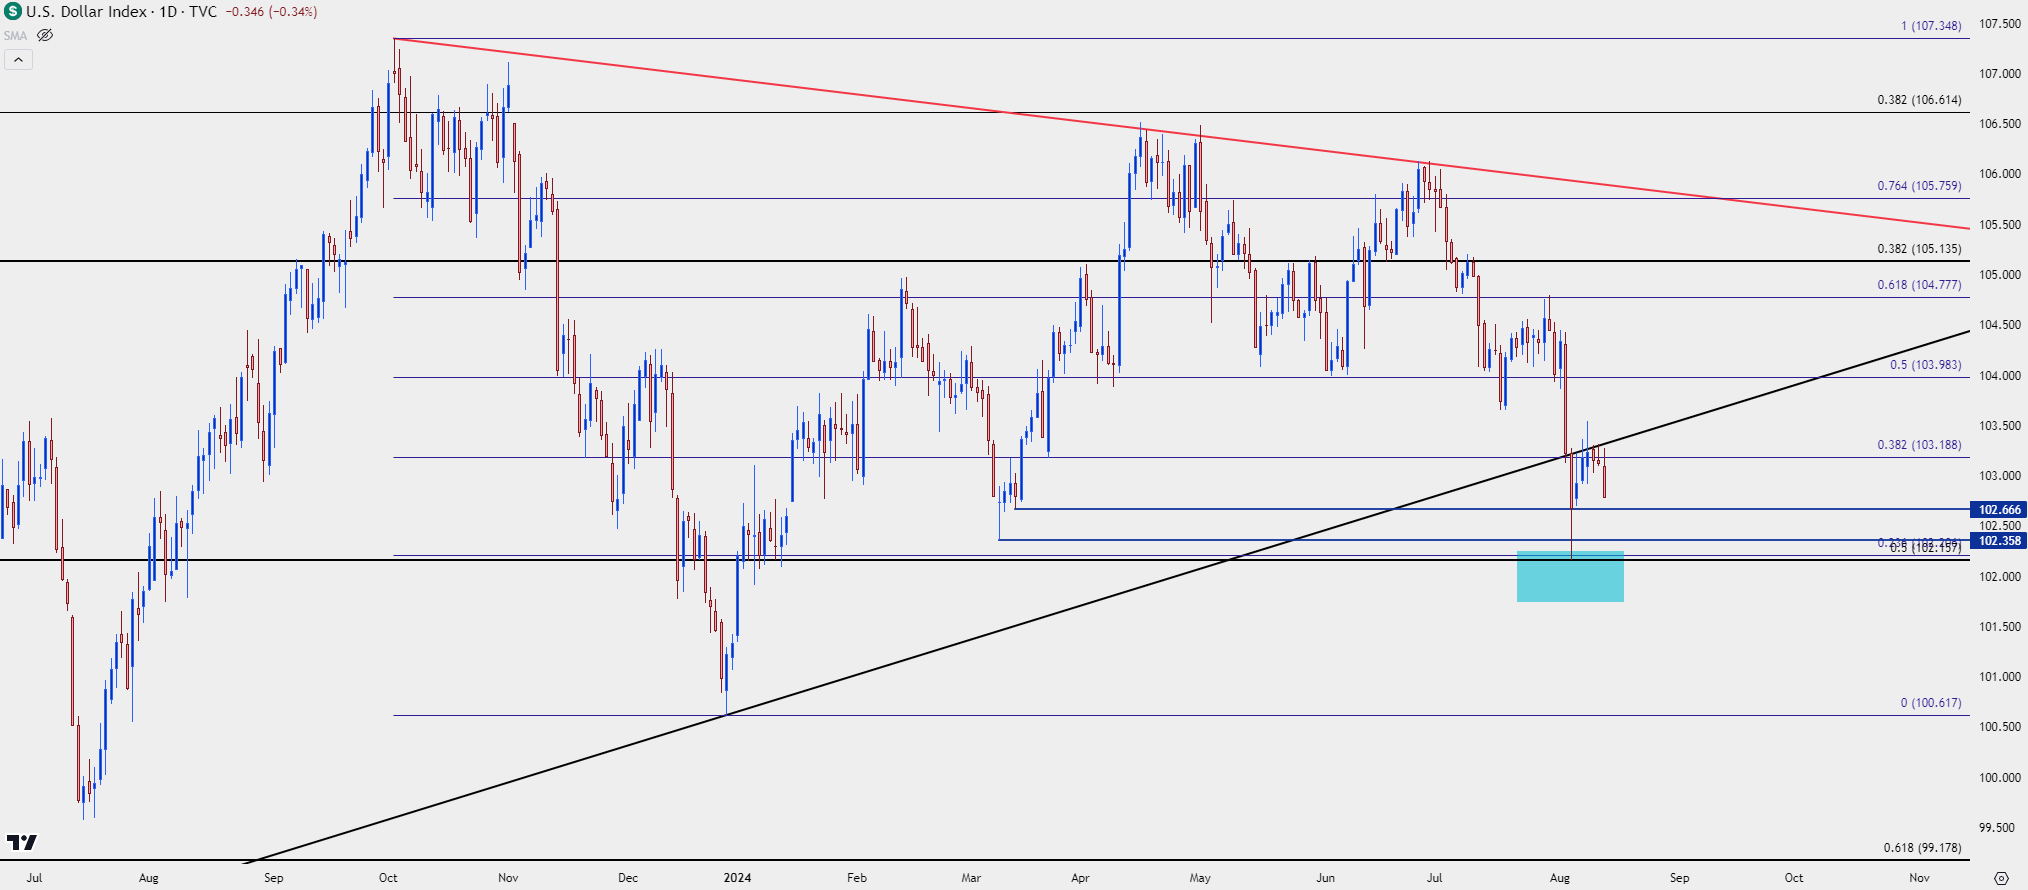 Chart prepared by James Stanley; data derived from Tradingview
EUR/USD 1.1000 Rejection
When that panic-driven sell-off in USD hit last week, EUR/USD attempted a breakout. Which for an economy expected to cut rates again a couple of times over the next few months makes for an impressive if not counter-intuitive move.
The pullback from that failed breakout at 1.1000 couldn’t find much selling pressure below 1.0900, however, so bulls remain in-control, short-term (and bears in control of DXY).
The more interesting scenario here in my opinion is the prospect of a lower-high with EUR/USD retaining the symmetrical triangle that’s been building over the past year. But – it’s 1.1000 that matters most, and bulls are making a forward push above the 1.0943-1.0960 zone at the moment, so there’s no clear evidence of a turn just yet.
EUR/USD Daily Price Chart
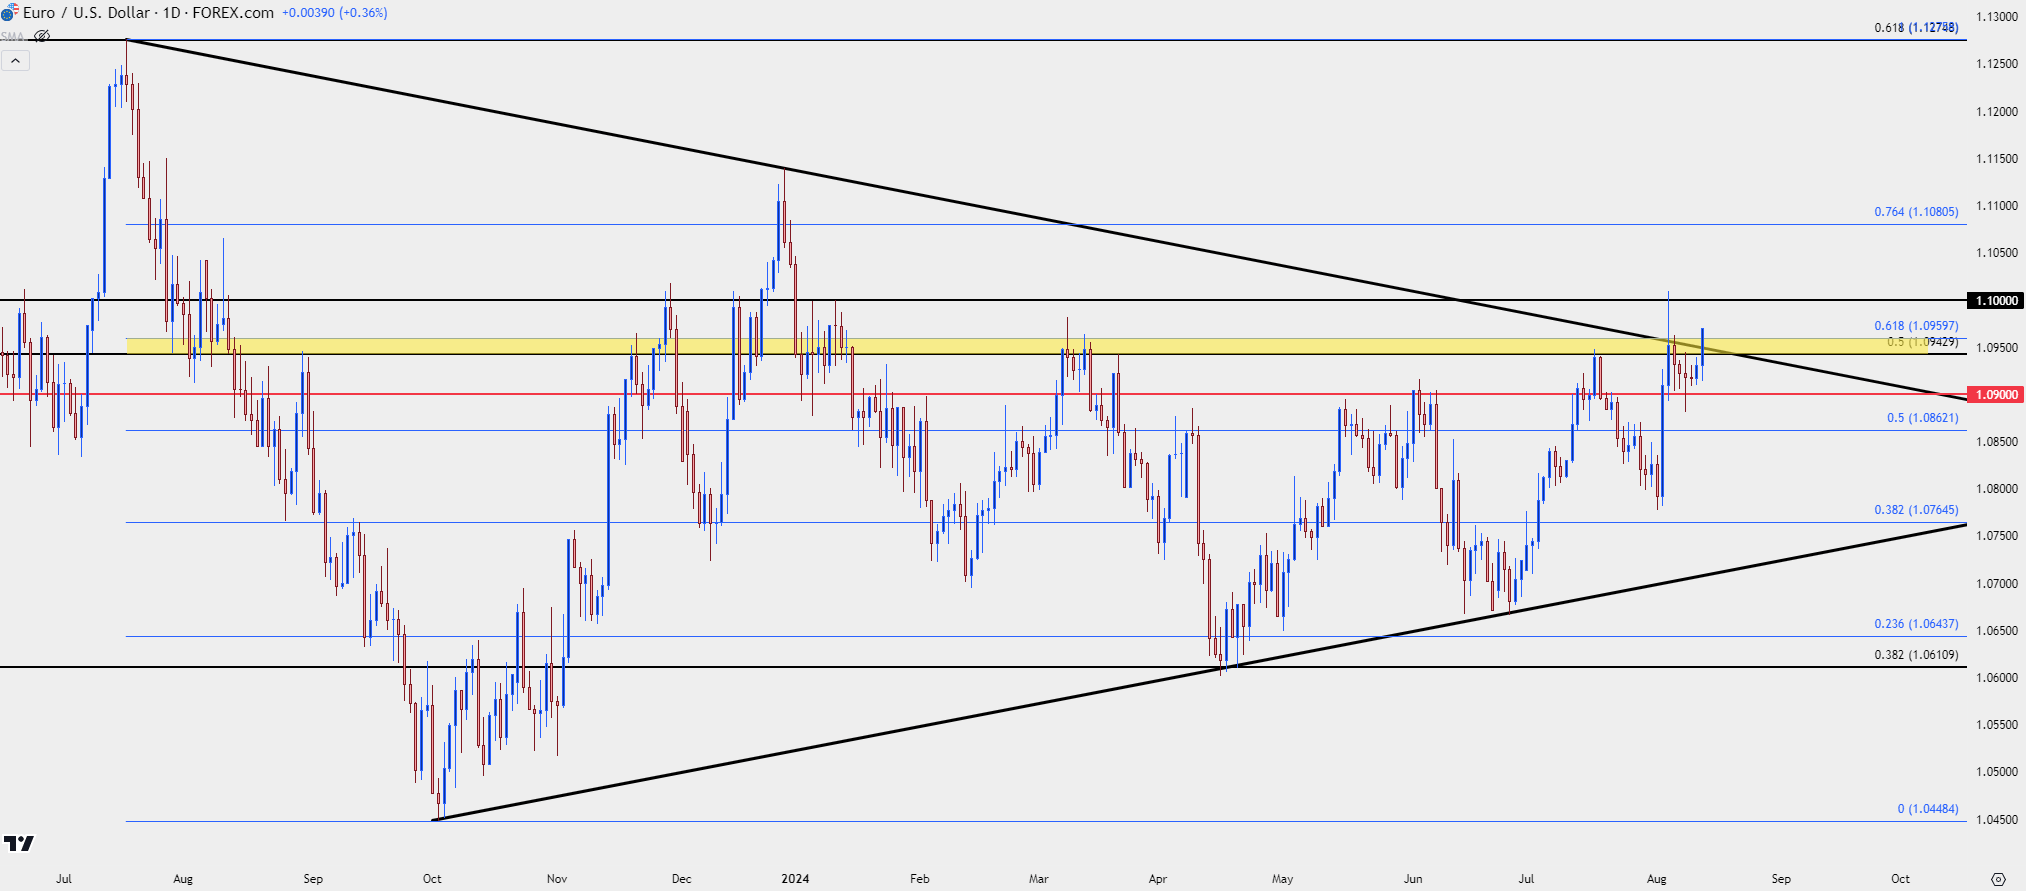 Chart prepared by James Stanley, EUR/USD on Tradingview
USD/JPY
I’m using the same exact structure that I had shared last week for USD/JPY as the pair has continued to find resistance at the 148.00 level, which is the 23.6% Fibonacci retracement of the 2021-2024 major move. While multiple banks have opined that ‘50%’ or ‘75%’ or ‘60%’ of the carry has unwound, the chart instead suggests that it’s closer to 23.6% given the technical backdrop. With FX being a de-centralized market with no central clearinghouse or exchange, it would be impossible to produce an exact figure. But, price is price, and has a tendency to wash out a lot of those extraneous factors.
More pressing to USD/JPY is the carry trade that’s certainly started to unwind, to some degree. But – the same question that I asked last week remains relevant today: Who is wanting to jump back on the long side of the carry when the US seems sure to cut rates in the coming months?
If those rate cuts are expected to be heavier, like a 50 bp move in September or 125 bps by the end of the year, carry traders that are still holding on could have even more motive to cut positions, realize profits and dodge the possibility of a reversal. Bulls tried a breakout yesterday and failed which suggests that there’s remaining latent selling pressure.
If CPI comes out very soft tomorrow, expectations for more rate cuts could heat up again, thereby giving sellers more reason to hit USD/JPY. If CPI prints in-line or near the expectation, the big question is whether bulls can prod a break of 148, and then a test of the major psychological level at 150.00 or perhaps the 152.00 level that the Bank of Japan had previously-defended.
While the BoJ walking rate hike talk back can help – that’s only one side of the pair and as we saw in Q4 of 2022 and 2023, sentiment is perhaps even more important than the factors behind the push.
At this point USD/JPY is clinging to bullish structure produced by the relief rally, but if sellers start to get more aggressive by taking out those higher-lows, there’ll be growing potential for a deeper sell-off in the pair.
USD/JPY Four-Hour Price Chart
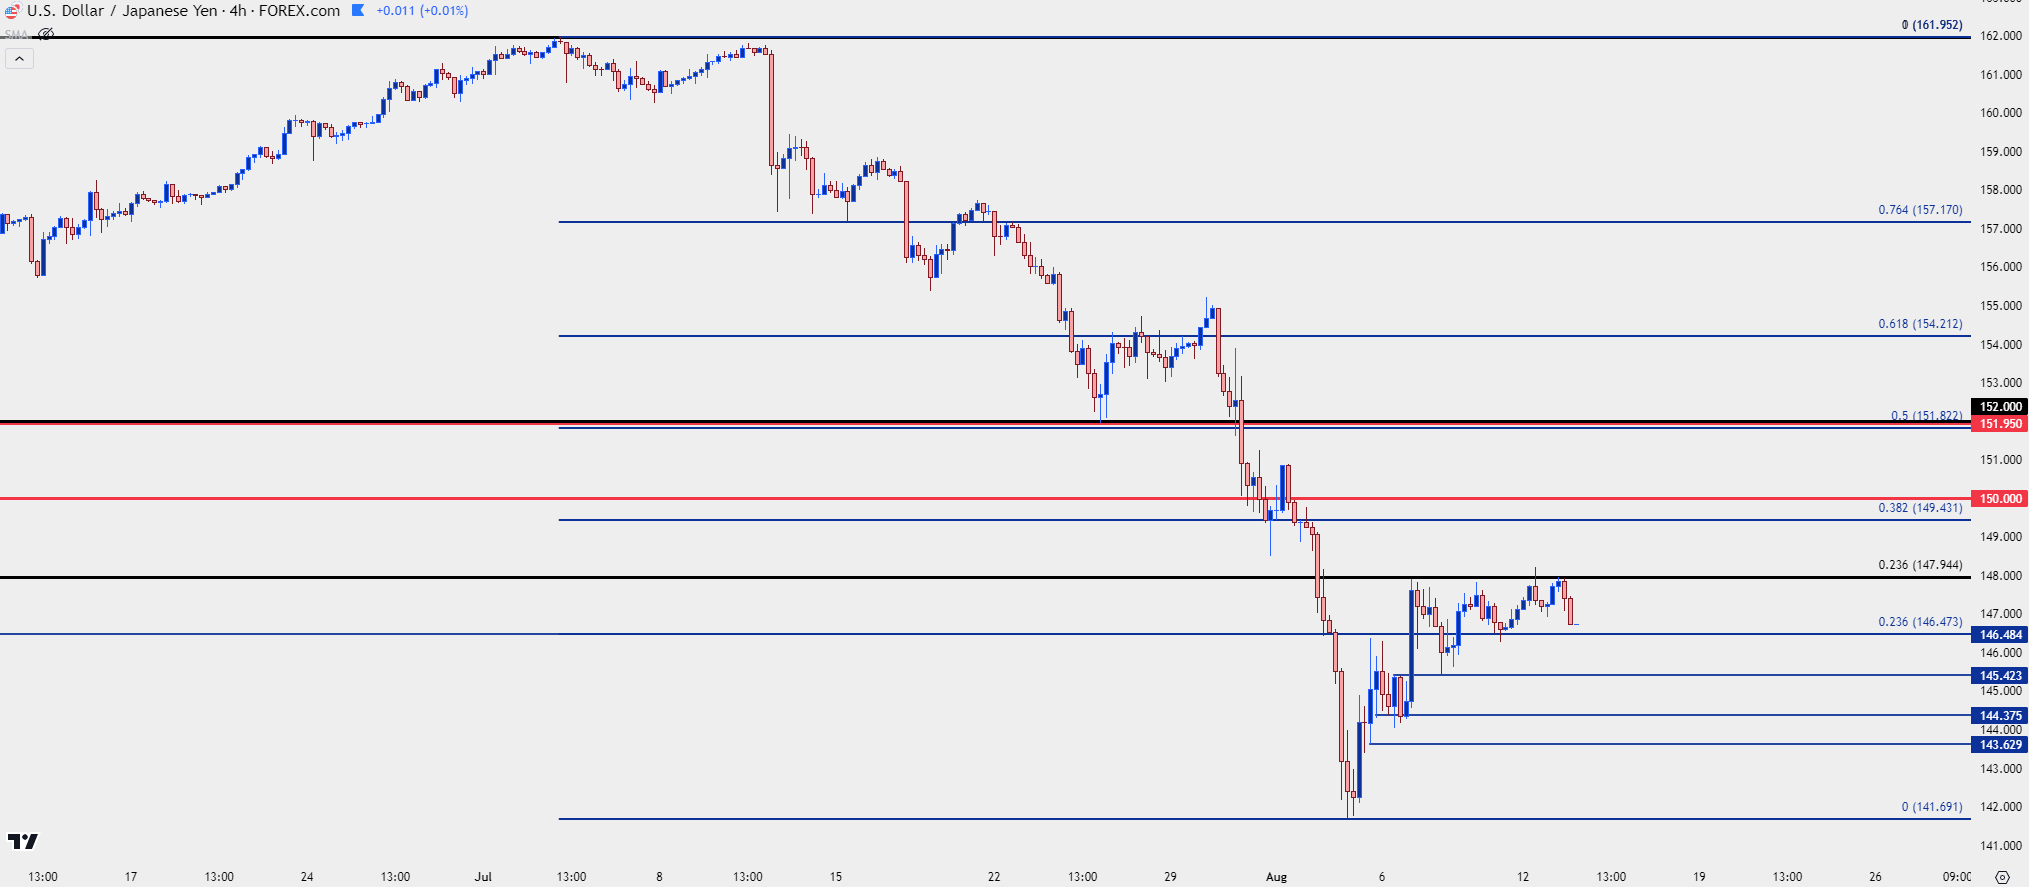 Chart prepared by James Stanley, USD/JPY on Tradingview
--- written by James Stanley, Senior Strategist


