Gold Technical Outlook: XAU/USD Short-term Trade Levels
- Gold prices surge more than 4.5% off monthly low- bulls eye resistance at record high
- XAU/USD threat for exhaustion / price inflection ahead- US key inflation data on tap
- Resistance 2469/83 (key), 2516/17, 2565– Support 2447, 2426/31, 2366 (key)
Gold prices surged into the weekly open with XAU/USD up nearly 2% off the Asia lows. A three-day rally has erased the early month losses with the bulls taking price back into resistance at the upper bounds of a multi-week consolidation pattern. Battle lines drawn on the XAU/USD short-term technical charts heading into key US inflation data.
Review my latest Weekly Strategy Webinar for an in-depth breakdown of this gold technical setup and more. Join live on Monday’s at 8:30am EST.
Gold Price Chart – XAU/USD Daily

Chart Prepared by Michael Boutros, Sr. Technical Strategist; XAU/USD on TradingView
Technical Outlook: In last month’s Gold Short-term Price Outlook we noted XAU/USD had turned from uptrend resistance and that, “rallies should be limited to the high-day close IF price is heading lower on this stretch with a break below 2366 needed to suggest a larger pullback is underway. Ultimately, we’re looking to confirm / identity an exhaustion low before resumption of the broader uptrend with a close above 2458 needed to fuel the next move to fresh record highs.”
Gold prices plunged lower the following day with XAU/USD marking a low-close at 2364 before rebounding sharply higher into the close of July. The rally faltered into resistance at the record high-close / record high at 2469/83 before plunging yet again with an intraday low / monthly opening-range low registering at 2364 last week. A three-day rally now takes gold back into key resistance at the record highs- its decision time for the bulls.
Gold Price Chart – XAU/USD 240min

Chart Prepared by Michael Boutros, Sr. Technical Strategist; XAU/USD on TradingView
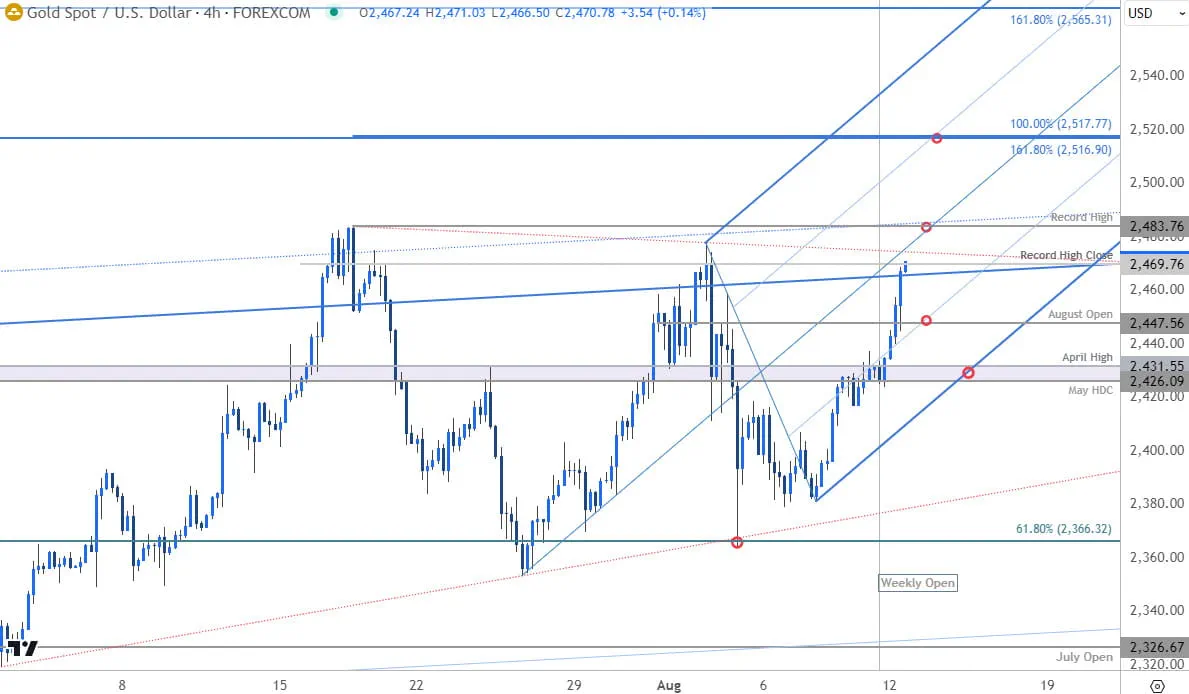
Notes: A closer look at gold price action shows XAU/USD trading within the confines of a proposed ascending pitchfork formation with the median-line further highlighting the 2469/83 resistance range- we’re looking for possible inflection off this zone in the days ahead.
A topside breach / close above is needed to fuel the next leg higher in price with subsequent resistance objectives eyed at the 161.8% extension of the October rally / 100% extension of the July rally at 2516/17 and the 1.618% extension of the broader 2022 advance at 2565 (both levels of interest for major price inflection IF reached).
Initial support rests with the objective August-open at 2447 with near-term bullish invalidation now raised to 2426/31- a region defined by the May high-day close (HDC), the objective weekly-open, and the April high. Losses below this threshold would suggest a more significant high was registered with a close below the 61.8% Fibonacci retracement at 2366 needed to validate a downside break of this multi-week consolidation pattern.
Bottom line: Gold is testing major resistance at the record highs and we’re looking for possible price inflection up there in the days ahead. From a trading standpoint, losses should be limited to 2426 IF price is heading higher on this stretch with a close above 2483 needed to mark uptrend resumption.
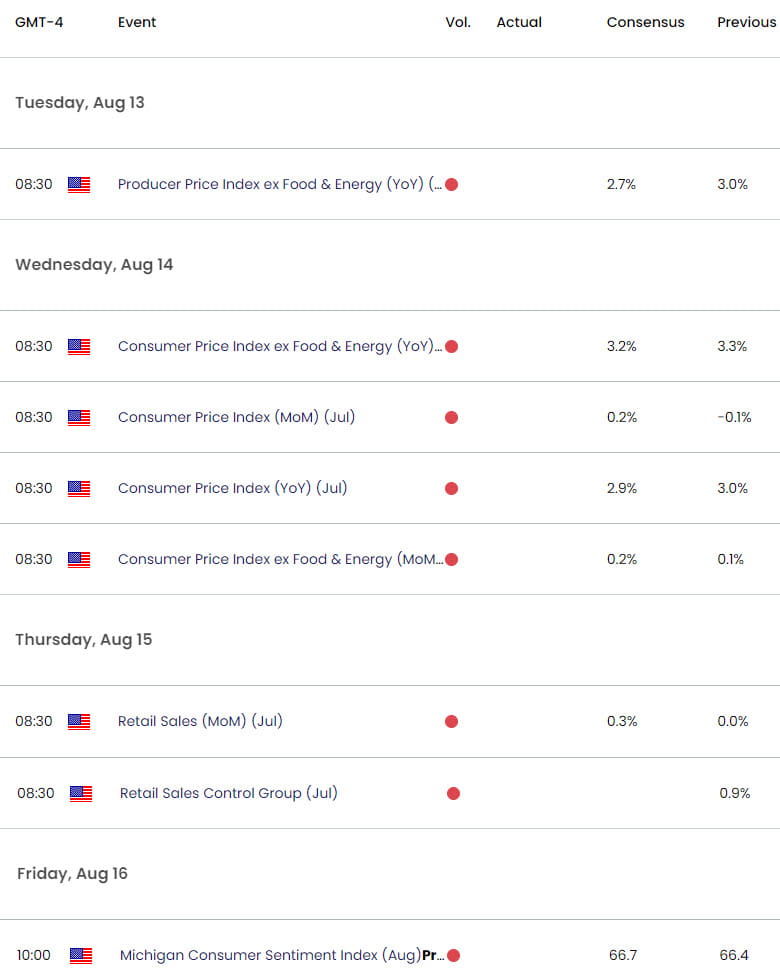
Keep in mind we get the releases of the July Consumer Price Index (CPI) on Wednesday with the August opening-range preserved heading into the close of trade on Monday. Look for the breakout for guidance and watch the weekly close here. Review my latest Gold Weekly Technical Forecast for a closer look at the longer-term look at the XAU/USD trade levels.
Key Economic Data Releases

Economic Calendar - latest economic developments and upcoming event risk.
Active Short-term Technical Charts
- Canadian Dollar Short-term Outlook: USD/CAD Reversal at Key Support
- US Dollar Short-term Technical Outlook: USD Bulls Emerge
- Australian Dollar Short-term Outlook: AUD/USD Defends 2024 Low
- Euro Short-term Technical Outlook: EUR/USD at Make-or-Break Resistance
- British Pound Short-term Outlook: BoE Rate Cut Drives GBP/USD into Support
--- Written by Michael Boutros, Sr Technical Strategist with FOREX.com
Follow Michael on X @MBForex


