Gold Technical Outlook: XAU/USD Short-term Trade Levels
- Gold prices straddle 200DMA for a fourth week- FOMC rally reverses sharply
- XAU/USD consolidation within monthly opening-range- breakout pending
- Resistance 1940, 1960/65 (key), 1982– Support 1903/1910, 1886, 1871/77
Gold prices are back on the defensive following the FOMC rate decision with a failed-breakout attempt yesterday reversing sharply lower. The move keeps XAU/USD within the September opening-range, and the focus remains on a breakout of this consolidation pattern in the days ahead. These are the updated targets and invalidation levels that matter on the XAU/USD short-term technical charts.
Review my latest Weekly Strategy Webinar for an in-depth breakdown of this gold technical setup and more. Join live on Monday’s at 8:30am EST.
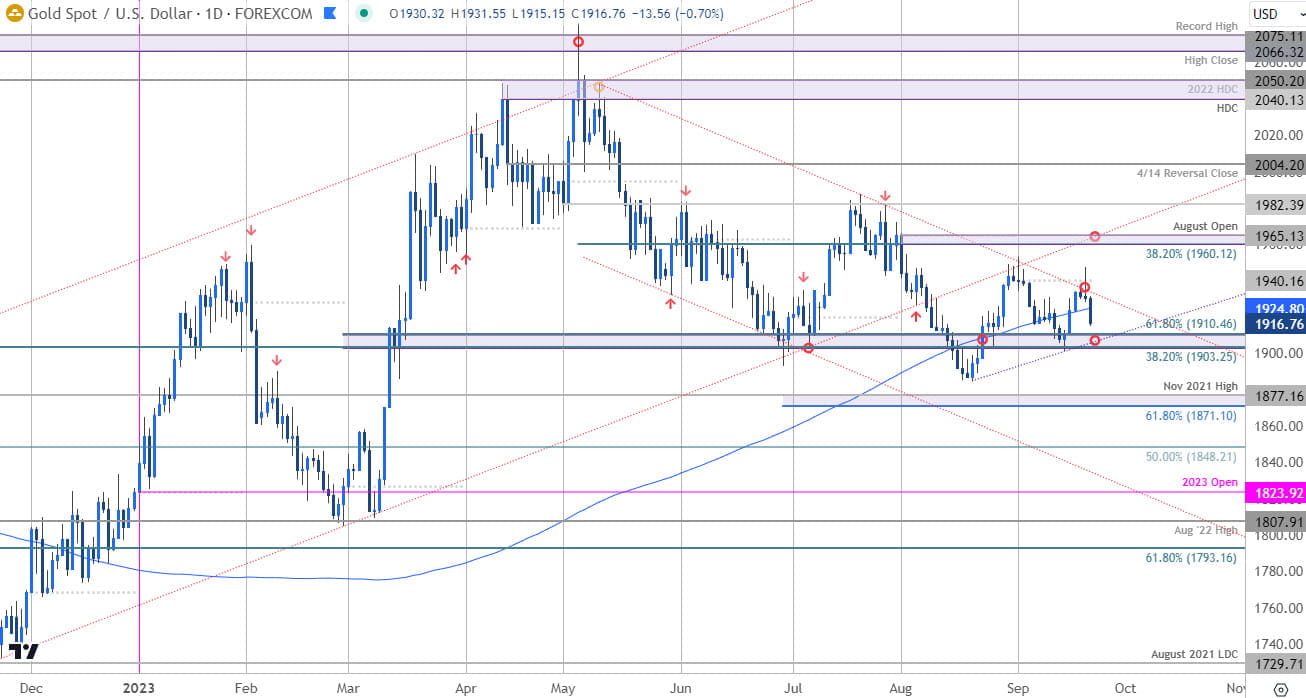
Gold Price Chart – XAU/USD Daily

Chart Prepared by Michael Boutros, Sr. Technical Strategist; XAU/USD on TradingView
Technical Outlook: In last month’s Gold Short-term Price Outlook we noted that the, “July downtrend is maturing here and historical tests of the 200-DMA in gold have often spent numerous days testing the average before breaking in either direction- expect some chop.” Gold prices have straddled this slope for the past four weeks with the September opening-range set firmly above technical support. A consolidation within the broader July decline keeps the immediate focus on a breakout of the 1903-1940 range for guidance.
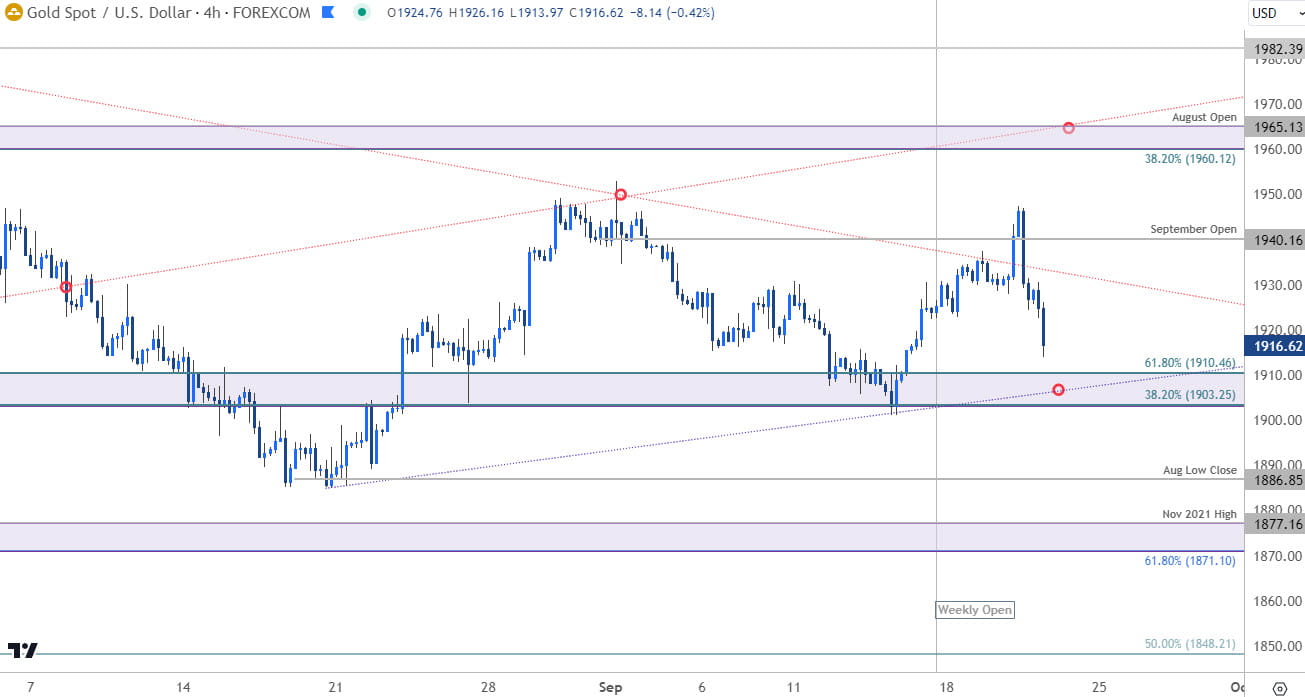
Gold Price Chart – XAU/USD 240min

Chart Prepared by Michael Boutros, Sr. Technical Strategist; XAU/USD on TradingView
Notes: A closer look at gold price action shows XAU/USD rebounding off a key inflection zone this month at 1903/1910- a region defined by the 38.2% retracement of the 2022 advance, the 61.8% Fibonacci retracement of the objective yearly range. A break / close below this threshold would threaten resumption of the broader April decline with subsequent support objectives eyed at the August low (1887) and 61.8% extension of the May decline / November 2021 high at 1871/77- an area of interest for possible downside exhaustion / price inflection IF reached.
Monthly open resistance steady at 1940 and is backed by the 38.2% retracement of the May sell-off / August open at 1960/65- a breach / close above this threshold is needed to suggest a more significant low was registered last month / a larger reversal is underway. Subsequent resistance objectives eyed at 1982 and 2004.
Bottom line: Gold prices are consolidating within the monthly opening-range, just above support- look for a breakout in the days ahead. From a trading standpoint, the threat remains weighted to the downside while below 1965 with a close sub-1903 needed to fuel the next leg lower in price- watch the weekly close. Review my latest Gold Weekly Technical Forecast for a longer-term look at the XAU/USD trade levels.
Active Short-term Technical Charts
- US Dollar Short-term Outlook: USD Bulls Face the Fed
- British Pound Short-Term Outlook: GBP/USD Probing Support
- Euro Short-term Outlook: EUR/USD Bears Halted Ahead of ECB, FOMC
- Canadian Dollar Short-term Outlook: USD/CAD Correction Underway
- S&P 500 Short-term Price Outlook: Gap Trap
- Crude Oil Short-term Outlook: Oil Spill Searches for Support
--- Written by Michael Boutros, Sr Technical Strategist with FOREX.com
Follow Michael on Twitter @MBForex


