Gold Technical Outlook: XAU/USD Short-term Trade Levels
- Gold prices rip 6.7% off downtrend support- recovers nearly 50% of September decline
- XAU/USD marks breakout of May downtrend- now testing 200DMA
- Resistance 1929, 1945 1977/87 (key) – Support 1903/1910, 1877, 1848 (key)
Gold prices are on a tear with a V-shaped recovery in XAU/USD attempting to validate a breakout of the May downtrend. While the breakout shifts the medium-term focus higher, the sheer breath and speed of the advance threatens exhaustion and we’re looking for some technical clarity up here. These are the updated targets and invalidation levels that matter on the XAU/USD short-term technical charts.
Review my latest Weekly Strategy Webinar for an in-depth breakdown of this gold technical setup and more. Join live on Monday’s at 8:30am EST.
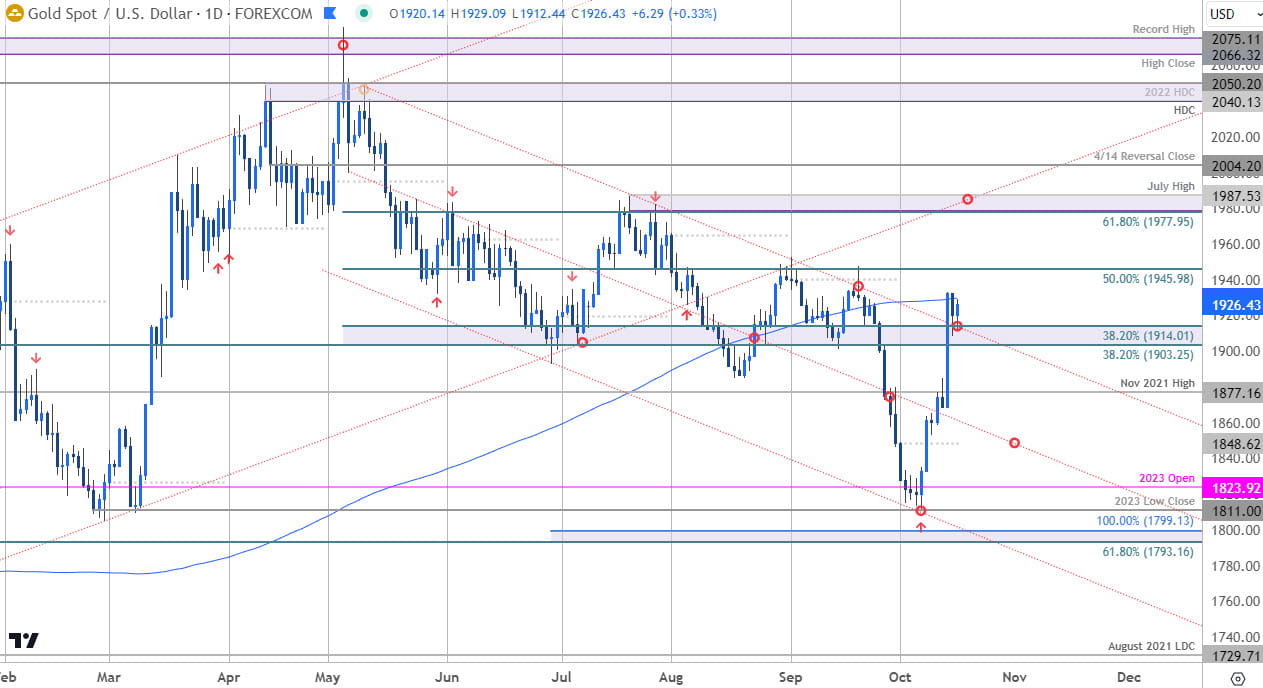
Gold Price Chart – XAU/USD Daily

Chart Prepared by Michael Boutros, Sr. Technical Strategist; XAU/USD on TradingView
Technical Outlook: In last month’s Gold Short-term Price Outlook we noted that XAU/USD had turned from downtrend resistance and that, “the threat remains weighted to the downside while below 1965 with a close sub-1903 needed to fuel the next leg lower in price.” Price plunged through support four days later with break unleashing a nine-day decline into confluent, downtrend support around the yearly low-close at 1811. The last historical reference of such a decline was back in May of 2016 – in that instance, the gold registered a multi-month low before reversing sharply to fresh yearly highs.
An outside-day reversal off the lows on October 6th (with momentum in historically oversold territory) has now surged more than 6.7% with the rally breaking through confluent downtrend resistance on Friday. It’s worth noting that the day of the breakout marked the second largest single-day rally since the start of the pandemic – the last two-instances of such an occurrence saw an average pullback of 4.2% before resumption to fresh highs. Gold has been struggling to mount the 200-day moving average (currently ~1929) for the past three days and the immediate focus is on a reaction off this mark.
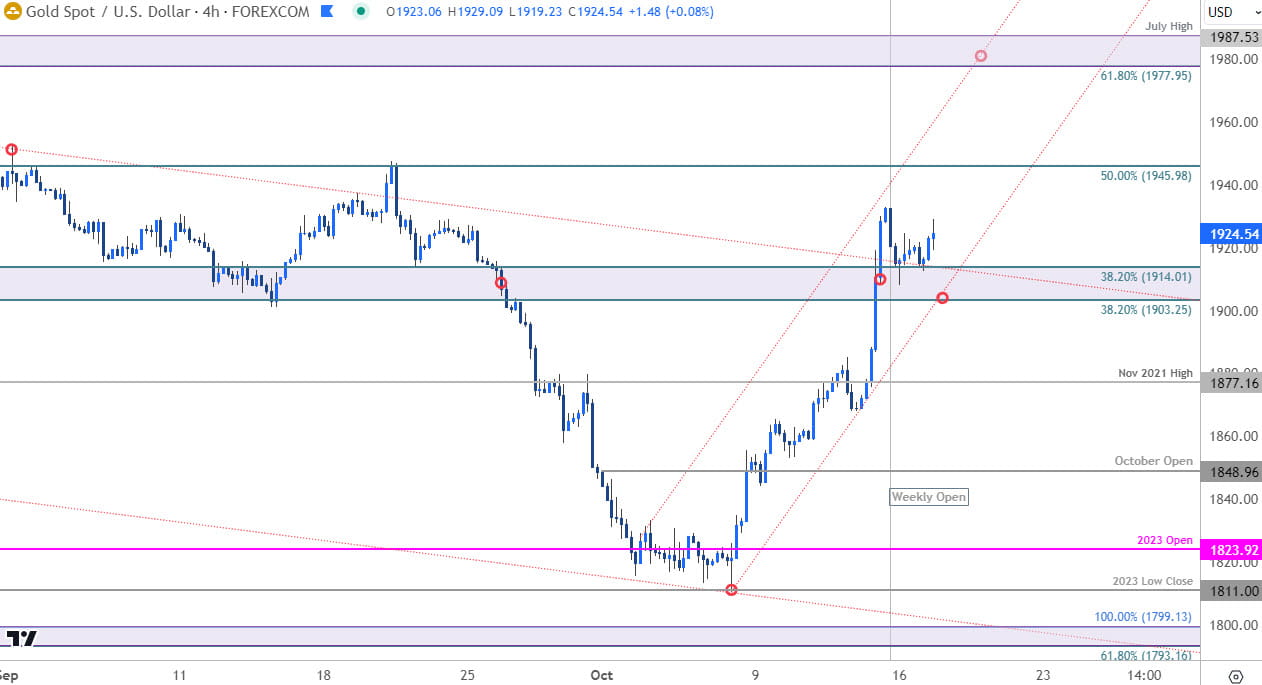
Gold Price Chart – XAU/USD 240min

Chart Prepared by Michael Boutros, Sr. Technical Strategist; XAU/USD on TradingView
Notes: A closer look at gold price action shows the magnitude and speed of the recent reversal with the advance trading within the confines of a narrow ascending channel. Initial resistance is now eyed at the 50% retracement of the May decline at 1945 backed by a more significant confluence at 1977/87- a region defined by the 61.8% Fibonacci retracement ad the objective July high. A breach / daily close above this threshold would b needed to mark resumption of the late-2022 uptrend towards 2004 and beyond.
Initial support now back at 1903/14- the immediate advance remains viable while above this threshold. A break / close below this pivot zone would threaten a deeper pullback into the November 2021 swing high at 1877 with broader bullish invalidation set to the objective monthly open at 1848- note that a 4% correction off the highs would take us into that zone (area of interest for possible downside exhaustion IF reached).
Bottom line: Gold prices have broken above confluent resistance with price now checking this zone as support. From a technical standpoint, recent price action suggests that a more significant low was registered this month and shifts the medium-term outlook back to the long-side while above the October-open at 1848. From at trading standpoint, the focus is on possible inflection off the 200DMA- losses should be limited to 1903 IF price is heading higher on this stretch with a close above 1945 needed to fuel the next leg higher. Review my latest Gold Weekly Technical Forecast for a longer-term look at the XAU/USD trade levels.
Active Short-term Technical Charts
- US Dollar Short-term Outlook: USD Battle Lines Defined Post-CPI
- British Pound Short-Term Outlook: GBP/USD Breakout Build
- Euro Short-term Outlook: EUR/USD Threatens July Downtrend
- Canadian Dollar Short-term Outlook: USD/CAD Rally Fizzles
- Crude Oil Short-term Outlook: Oil Rally Reignites
--- Written by Michael Boutros, Sr Technical Strategist with FOREX.com
Follow Michael on Twitter @MBForex


