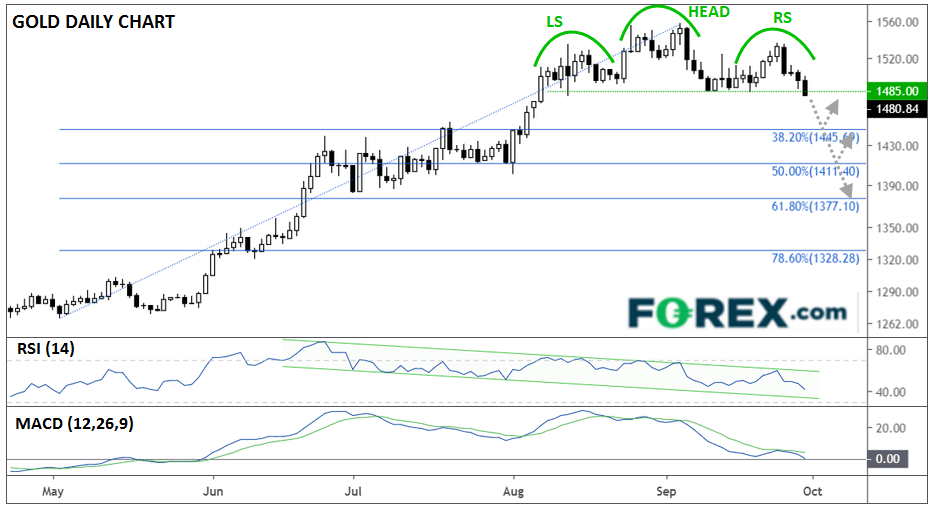
As my colleague Matt Simpson noted last week, “the daily trend [in gold] remains bullish above $1480,” but as US traders sit down at their desks for the first day of the trading week, that key support level is at risk of breaking.
Looking at the chart below, gold’s uptrend has lost momentum over the last six weeks, with prices unable to make much progress through the mid-$1500s. Over that period, the yellow metal has gone from putting in higher highs and higher lows to lower highs and lower lows, creating a textbook “head-and-shoulders” pattern. This pattern shows a shift from a bullish to a bearish trend and is often seen at important tops in the market:

Source: TradingView, FOREX.com
Meanwhile, the RSI indicator is in a bearish channel, and the MACD is trending lower below its signal line and about to cross the “0” level. In other words, the secondary indicators are confirming the price reversal, suggesting that bears may be taking the upper hand.
In a mirror image of Matt’s comments last week, the short-term trend has now shifted to bearish as long as gold remains below its head-and-shoulders pattern “neckline” in the $1480-1485 area. To the downside, bears may look to target the Fibonacci retracements of this summer’s rally starting at $1445 (38.2%), $1411 (50%), and $1377 (61.8%), as well as the “measured move” projection of the head-and-shoulders pattern at $1400.
Of course, traders must also consider the fundamental outlook for the yellow metal. With global interest rates still at depressed levels and several geopolitical hotspots still at risk of a significant disruption, bears should be cognizant of the risk of a bullish reversal near these key support levels.


