Gold, USD/JPY Talking Points:
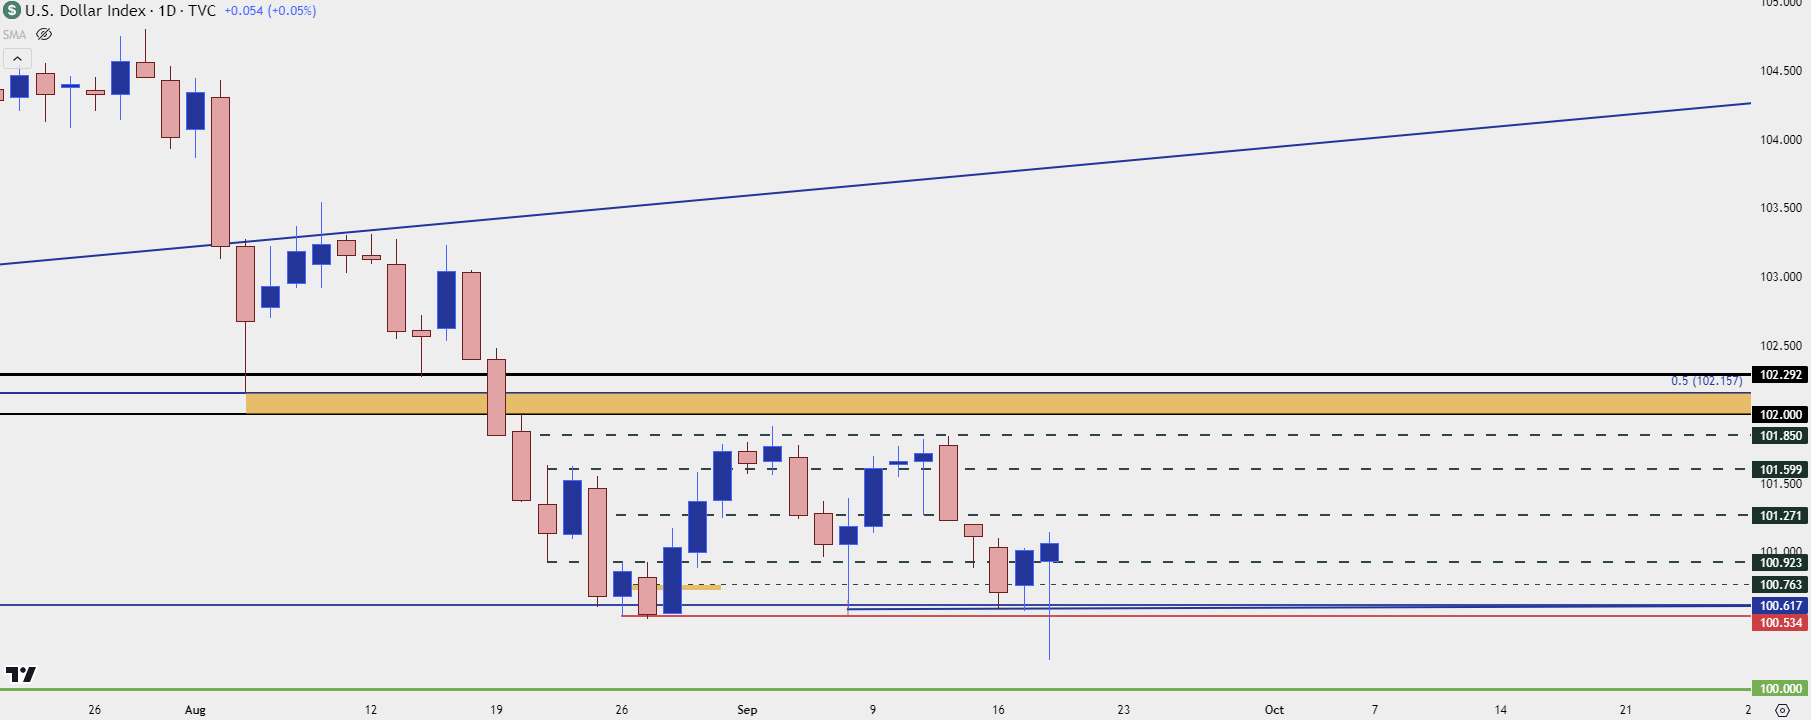
- Some strong reactions across markets as USD bears had an open door to run after setting a fresh low in the minutes after the rate cut announcements. But that first move was faded and at this point the USD daily bar has almost turned green.
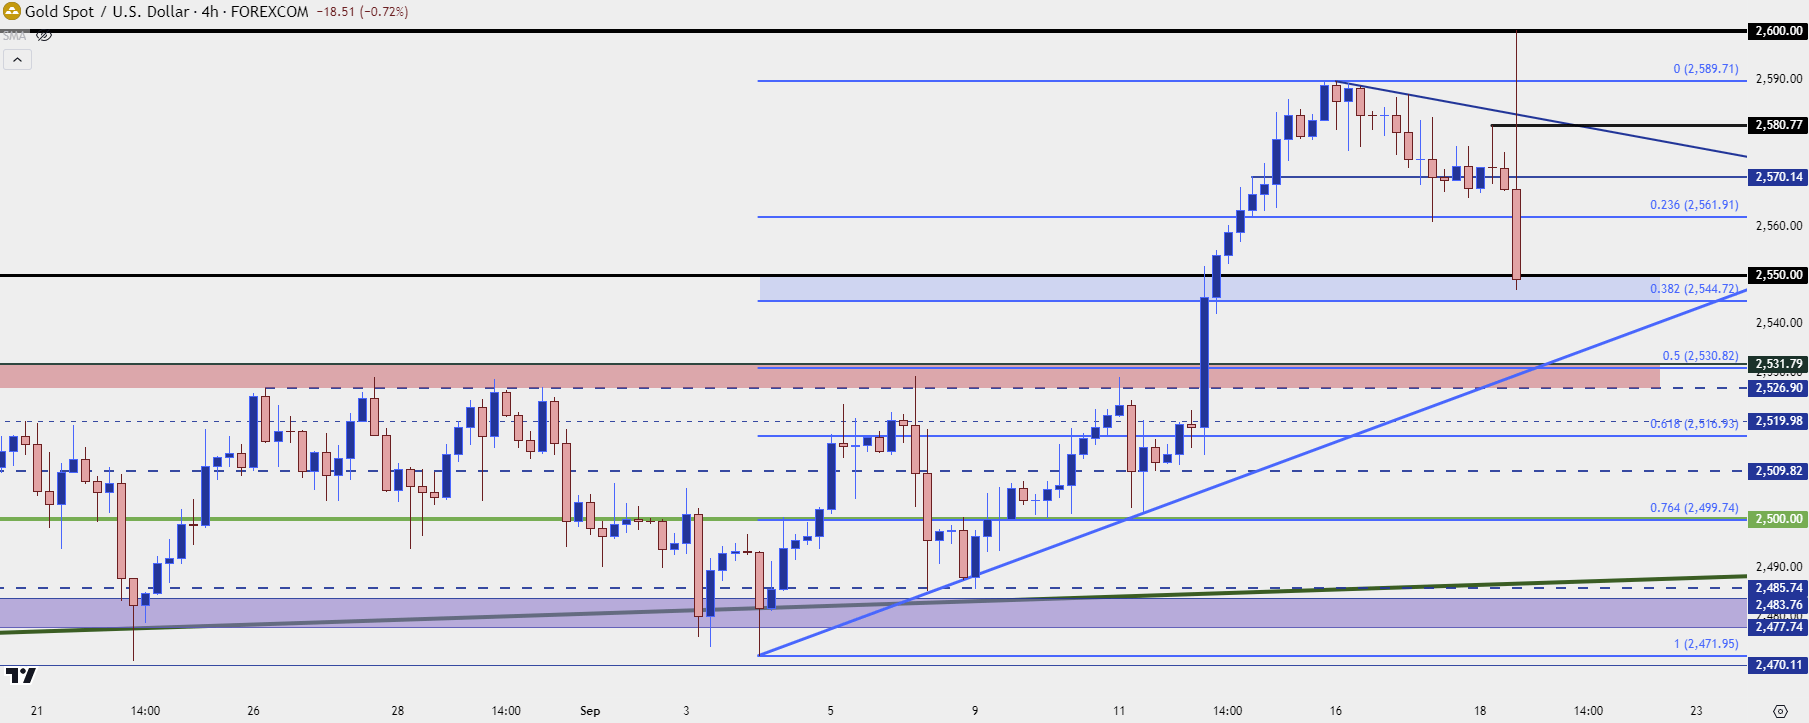
- I looked at the prospect of pullbacks in Gold ahead of the rate decision and that’s what’s played out so far after buyers failed at the 2600 psychological level. This doesn’t mean that the bullish trend is dead, however; and USD/JPY saw buyers show up ahead of a test of a key support zone. Monitoring how this is treated through the Asian session tonight will be important.
- I’ll be looking into these setups in the Tuesday webinar and you’re welcome to join, click here for registration information.
The Fed went 50 yet the USD has turned green on the day, but you can’t blame bears for not trying.
I had looked into this through gold ahead of today’s rate decision, highlighting pullback potential. While the yellow metal initially broke out to a fresh all-time-high, the 2600 level served as a strong spot of resistance and that has reversed the move aggressively. The supports zones that I was looking at in that prior article and video have already come into play with 2544-2550 seeing a test, as of this writing (but hadn’t yet come into play at the time of producing the above video).
There’s another major spot of support in gold that’s a little lower, if this zone doesn’t hold, and that plots from prior range resistance, around 2527-2531. Interestingly, it was prior range resistance that led into the recent advance, but that’s when gold was still working to gain acceptance above 2500.
Gold (XAU/USD) Four-Hour Price Chart
 Chart prepared by James Stanley; data derived from Tradingview
USD – Fresh Yearly Low and then Reverse
The USD range remains in-play after price failed to run the breakdown. If we do see the Asian session drive USD/JPY below support, this can change, of course; but at this point, prior range dynamics are back at-play.
At the time of the above video we were seeing some resistance play around 100.92. I’m also tracking levels at 101.27, 101.60 and then 101.85. Above that, the 102-102.16 zone is a massive spot that bulls will need to drive through if they want to take greater control of the bigger picture trend.
US Dollar Daily Price Chart
 Chart prepared by James Stanley; data derived from Tradingview
USD/JPY
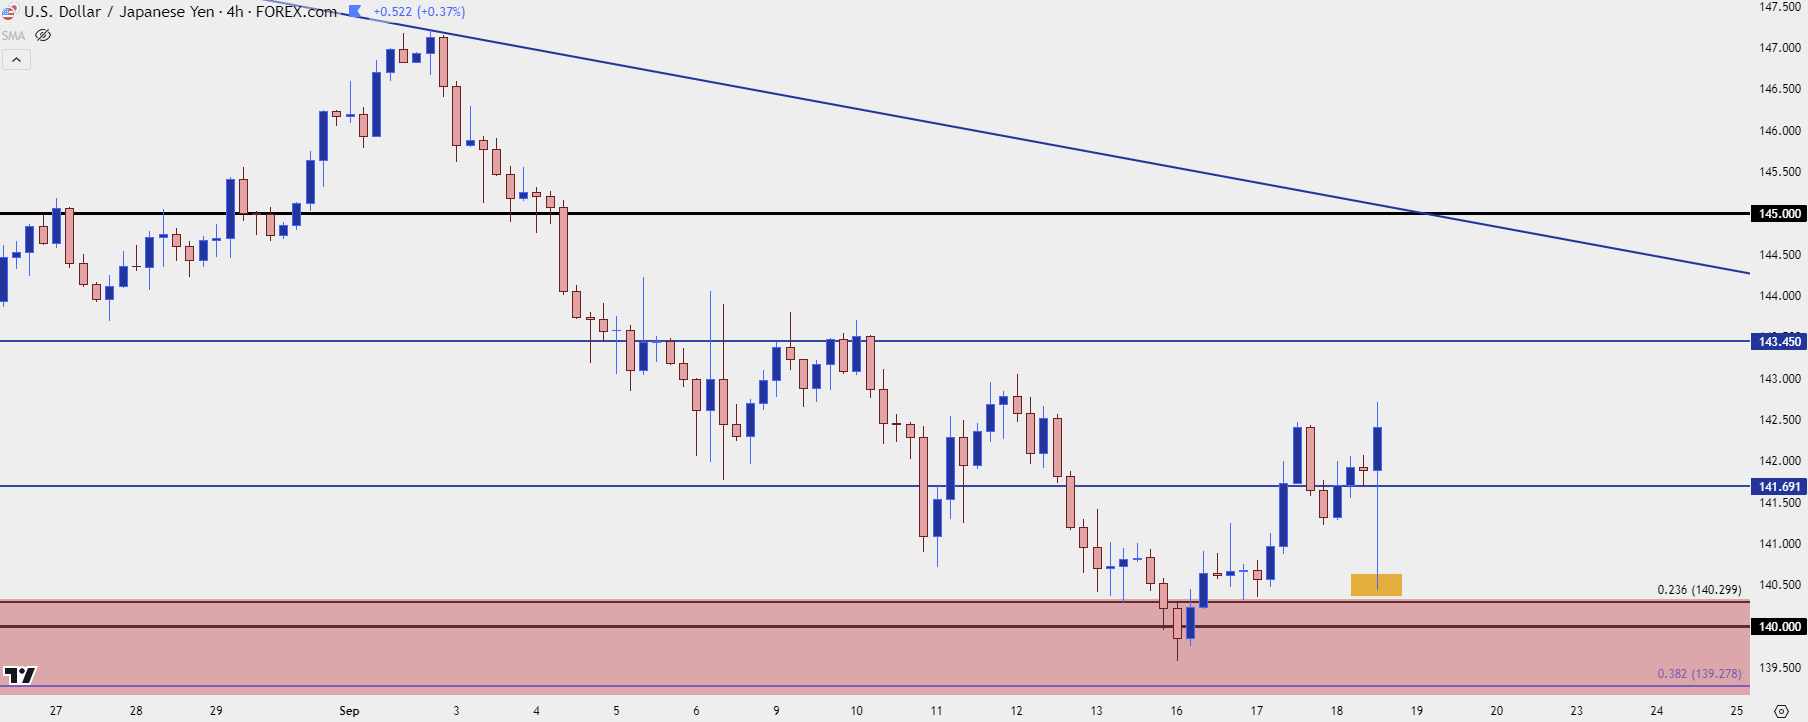
This is where I think the next big test will be. From a fundamental basis the long side of the pair is even less attractive after the Fed cut by 50 bps, while also highlighting the possibility of another 50 bps of cuts by the end of the year. But interestingly, the technical backdrop doesn’t match that assessment as bulls showed up to defend a key support zone around today’s rate decision. I’ve highlighted this higher-low in orange on the below chart.
USD/JPY Four-Hour Price Chart
 Chart prepared by James Stanley, USD/JPY on Tradingview
USD/JPY Lower-High Resistance
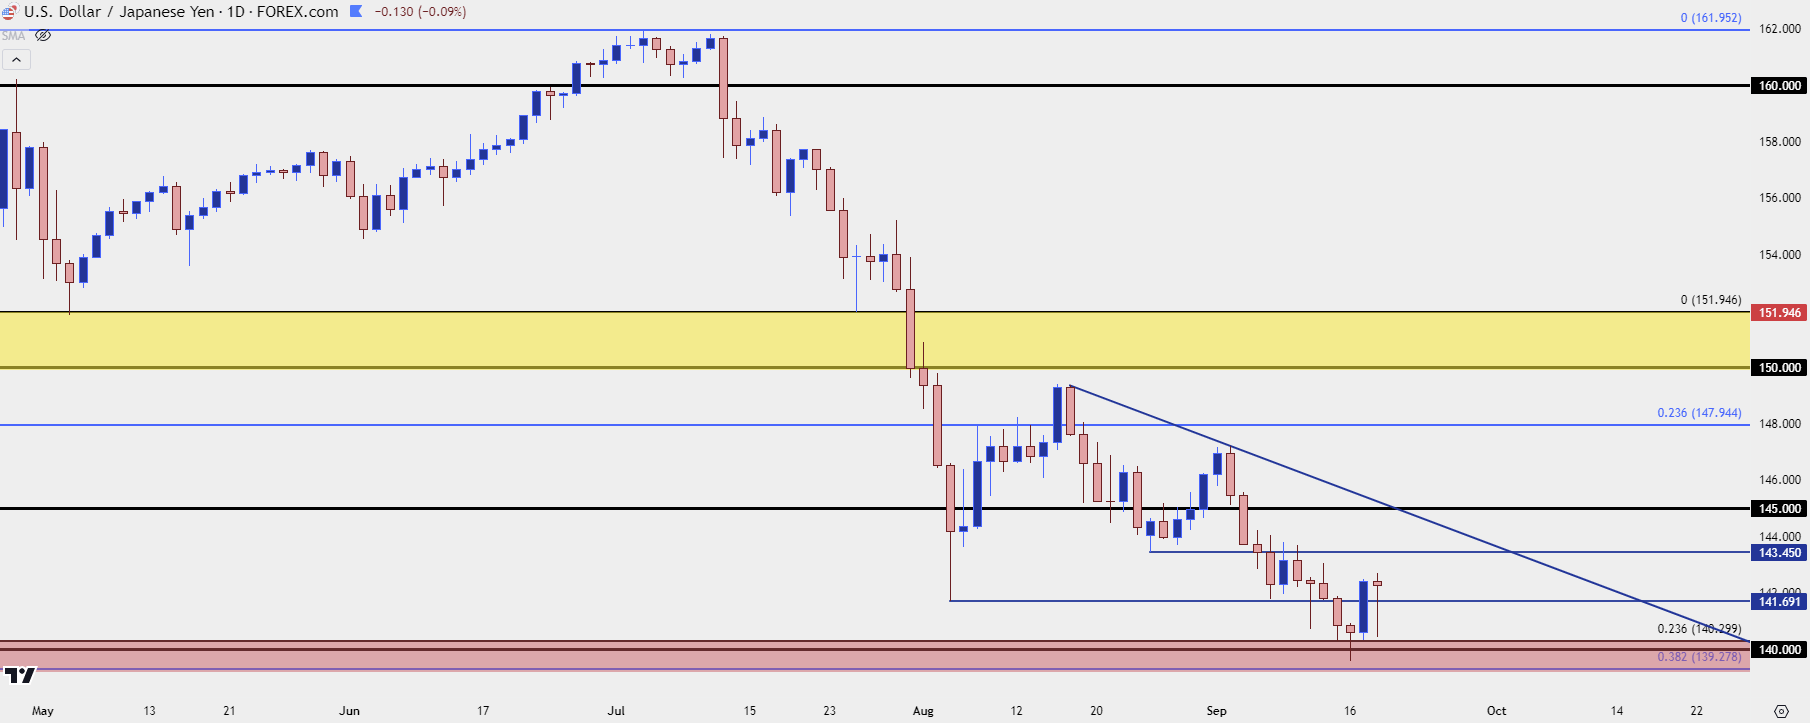
With sellers having failed to run a break, the question now is what they can do on tests of possible resistance levels. The 143.45 level is the next up on my chart, and the 145 level is after that which is now confluent with the bearish trendline connecting mid-August and September swing highs.
This isn’t something that would make me want to get suddenly bullish on the pair as that fundamental backdrop has become even less attractive after the FOMC’s announcement today. But, as I’ve been sharing in videos of late, fundamentals aren’t a direct driver of price as the conduit in between is supply and demand from buyers and sellers.
So if this begins to break that support in USD/JPY, matters can shift quickly in the USD and other related pairs, such as EUR/USD and GBP/USD.
USD/JPY Daily Price Chart
 Chart prepared by James Stanley, USD/JPY on Tradingview
--- written by James Stanley, Senior Strategist


