Gold talking points:
- Gold’s current 10-month high of 1975 came into play in early-February, after which bears have been making a mark on near-term price action.
- Last week produced a possible change-of-pace with a bullish engulfing pattern but we’re at the half-way point
- James hosts a free webinar every Tuesday at 1PM ET. If you’d like to sign up, this link will allow for registration.
Gold prices had a rough six-month-stretch last year after another failure to hold above the 2k level. Gold prices topped in March, right around the time of the Fed’s first hike for the recent rising rate cycle, and as the bank ramped up the hawkishness through the summer gold prices continued their descent.
Eventually, support began to show up in late-September, right around the 50% mark of the prior major move, spanning from the 2018 low up to the 2020 high. Perhaps coincidentally, that major move was driven by the Fed’s prior cutting cycle as the bank had started to get more dovish ahead of the 2019 open.
The 50% marker from that Fibonacci study plotted at 1628, and that price was tested over three separate iterations in September, October, and November. And as hopes began to percolate that the Fed might bring a softer touch to markets, gold bulls went back to work, and price rallied by 22.05% from the November low to the February high. That’s around the time that another Fibonacci level came into play, as the 76.4% marker of the sell-off move came-in to help hold the highs.
Since that price came into play in early-February, gold prices had been sliding lower into last week’s trade.
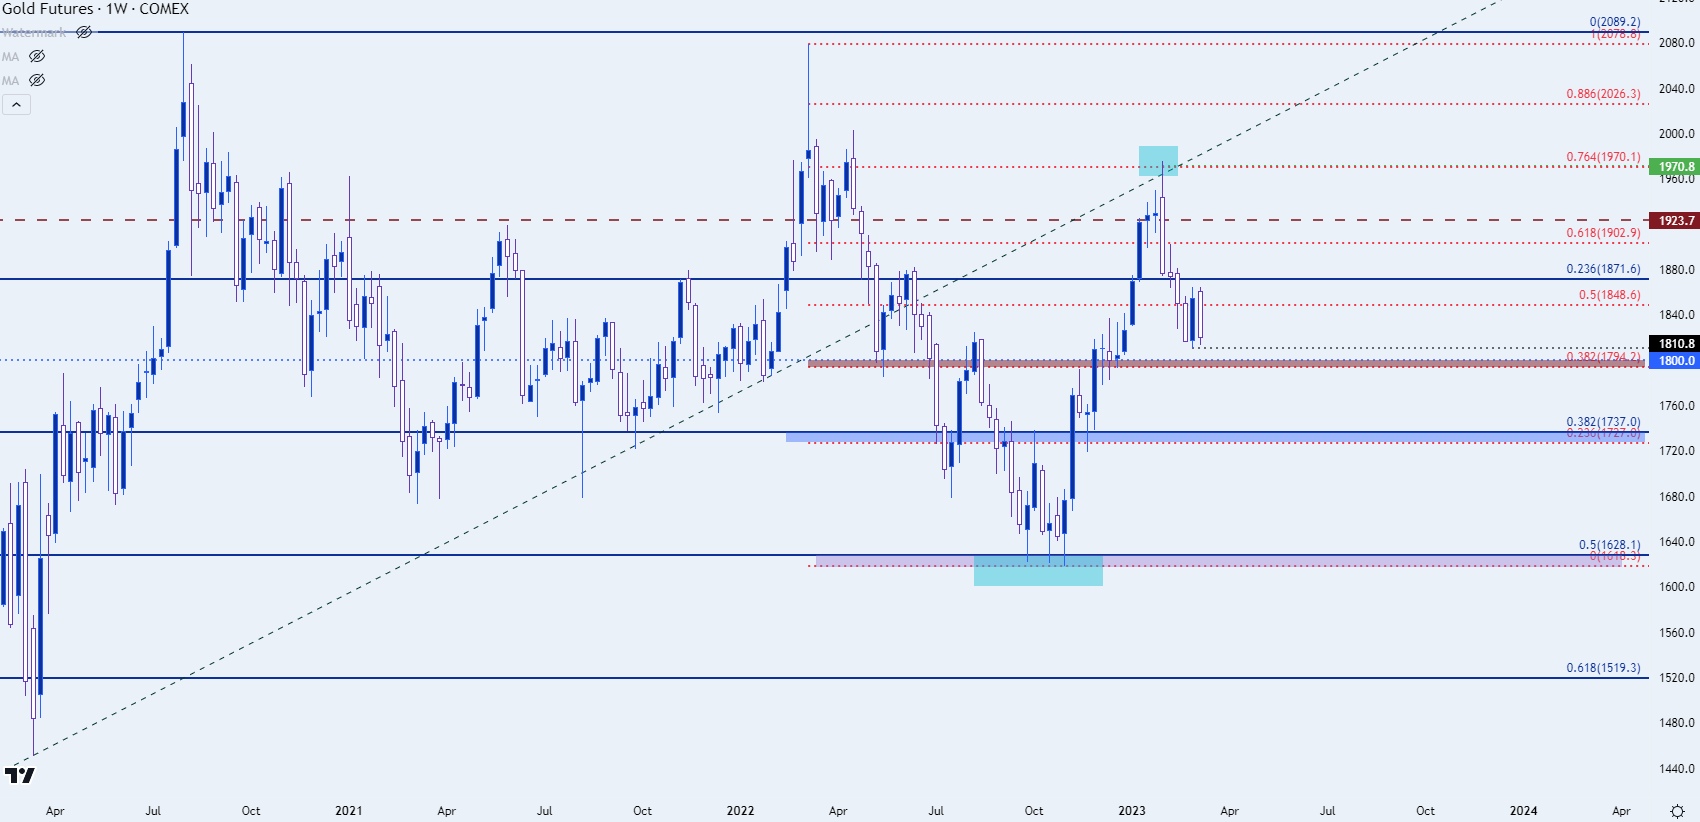
Gold weekly price chart Chart prepared by James Stanley, Gold on Tradingview
Last week saw a change-of-pace in gold prices as a bullish engulfing formation built on the weekly chart as price printed its first green candle since the resistance inflection earlier February. Engulfing formations are often tracked with the aim of momentum continuation, and given the context, where that candle printed after four weeks of bearish price action, the door started to open to more bullish potential.
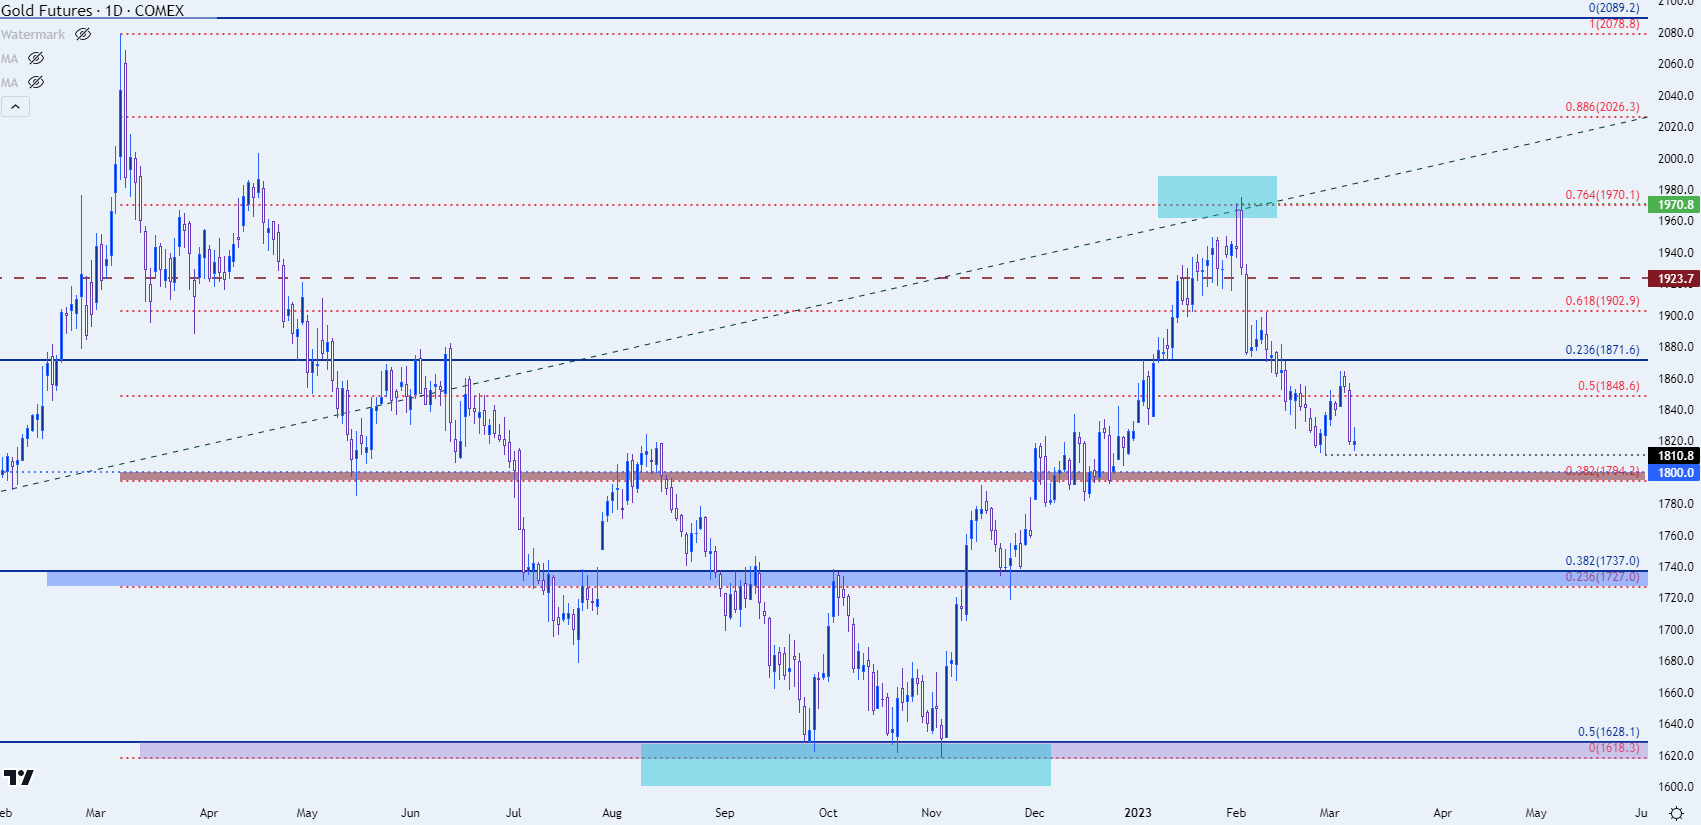
As of this writing we’re now at the half-way point for the following week and while the bullish engulfing pattern hasn’t yet been completely negated, it’s not looking optimistic for bulls. A breach of last week’s low nullifies the formation and makes quite the statement for bears, putting focus on the 1800 psychological level after which the 1795 level comes into play, which houses the 38.2% Fibonacci level from the recent sell-off move.
Gold daily price chart Chart prepared by James Stanley, Gold on Tradingview
Gold bigger picture
At this point risk on/off trends have continued to have impact on gold price action, and that theme is likely to remain center-stage as markets attempt to estimate just how hawkish the Federal Reserve will need to be for the remainder of this year, and that, of course, has some relation with inflation performance.
With sellers potentially nullifying last week’s bullish engulf pattern on the weekly, this highlights bigger picture bearish potential with a key zone of confluence sitting in the 1727-1737 area of the chart. The 1737 level is the 38.2% Fibonacci retracement of the 2018-2020 major move while 1727 is the 23.6% retracement of last year’s sell-off.
Gold weekly chart
 Chart prepared by James Stanley, Gold on Tradingview
--- written by James Stanley, Senior Strategist
Follow James on Twitter @JStanleyFX


