Gold Talking Points:
- Gold prices continue to sell-off in the aftermath of last week’s FOMC rate decision and this happens along side a massive breakout in US Treasury yields, pushed along by the thought of fewer possible rate cuts from the Fed next year.
- Tomorrow brings PCE data and this can be key as that’s the Fed’s preferred inflation gauge and the way that prints can impact rate hike odds for next year. And then next week brings Non-farm Payrolls so markets will get a look at updated employment data out of the US.
- I’ll be discussing these themes in-depth in the weekly webinar on Tuesday at 1PM ET. It’s free for all to register: Click here to register.
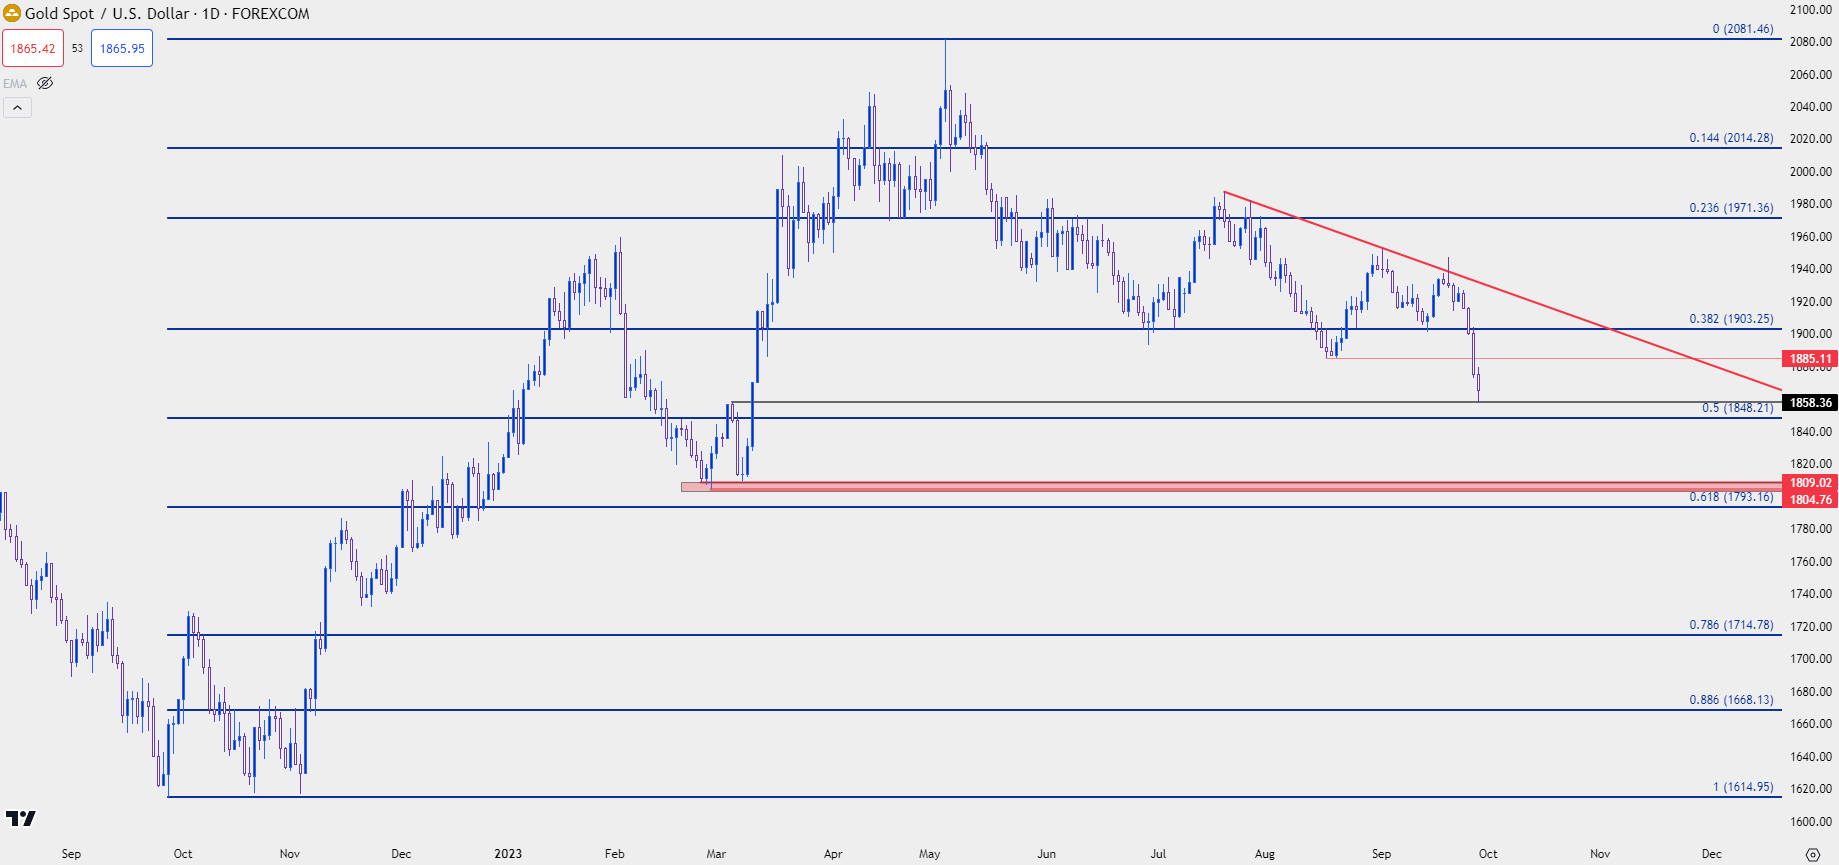
Gold prices continue to fall through the floor and the running tally since last week’s FOMC rate decision is now at a total move of -4.61% from last Wednesday’s high down to this morning’s low. Perhaps more notable than that is where this move has shown, as gold prices have pushed through a number of supports on the way to fresh six-month lows.
Leading into last week’s FOMC rate decisions bulls still had some sway on the matter as support had held at a higher-low. But the big takeaway from last week’s FOMC has continued to produce reverberations more than a week later and that’s the move that’s shown in US Treasury rates, and that’s taken a significant toll on gold prices.
The main concern is the Fed’s stance for next year as the big item from last week’s rate decision was the simple reduction in expectation for cuts next year, to two from four. But, this also brings along with it the question of just how far along the Fed is with the bank’s fight against inflation. If markets are looking at one more possible hike along with four cuts for next year, well that sounds like we’re close to having the job completed. But – if looking at economic data that synopsis isn’t so sound, as some items have remained strong and just last month we saw headline inflation accelerate again. So reducing that expectation to two cuts for next year is not nearly as optimistic and it seems that the uncertainty spoken to with this dynamic is what’s giving markets problems at the moment: That inflation isn’t tamed and the Fed isn’t certain when it might be.
Markets generally abhor uncertainty and while the dot plot matrix does supply a bit of comfort by sharing the Fed’s long-ranging projections, as Chair Powell reminds nearly every rate decision, projections are subject to change and that’s what we’re seeing price through markets at the moment.
In spot gold, this has led to a fresh six month low as rate cut bets have gotten priced-out to a degree. Today’s low has so far held at a prior resistance swing, plotted around 1958.36. There’s another spot of support a little lower, around 1848, which is the 50% marker from the recent bullish move. And 1885 was previously a key support, that now becomes resistance potential.
Gold (XAU/USD) Daily Price Chart

Chart prepared by James Stanley, Gold on Tradingview
Gold shorter-term
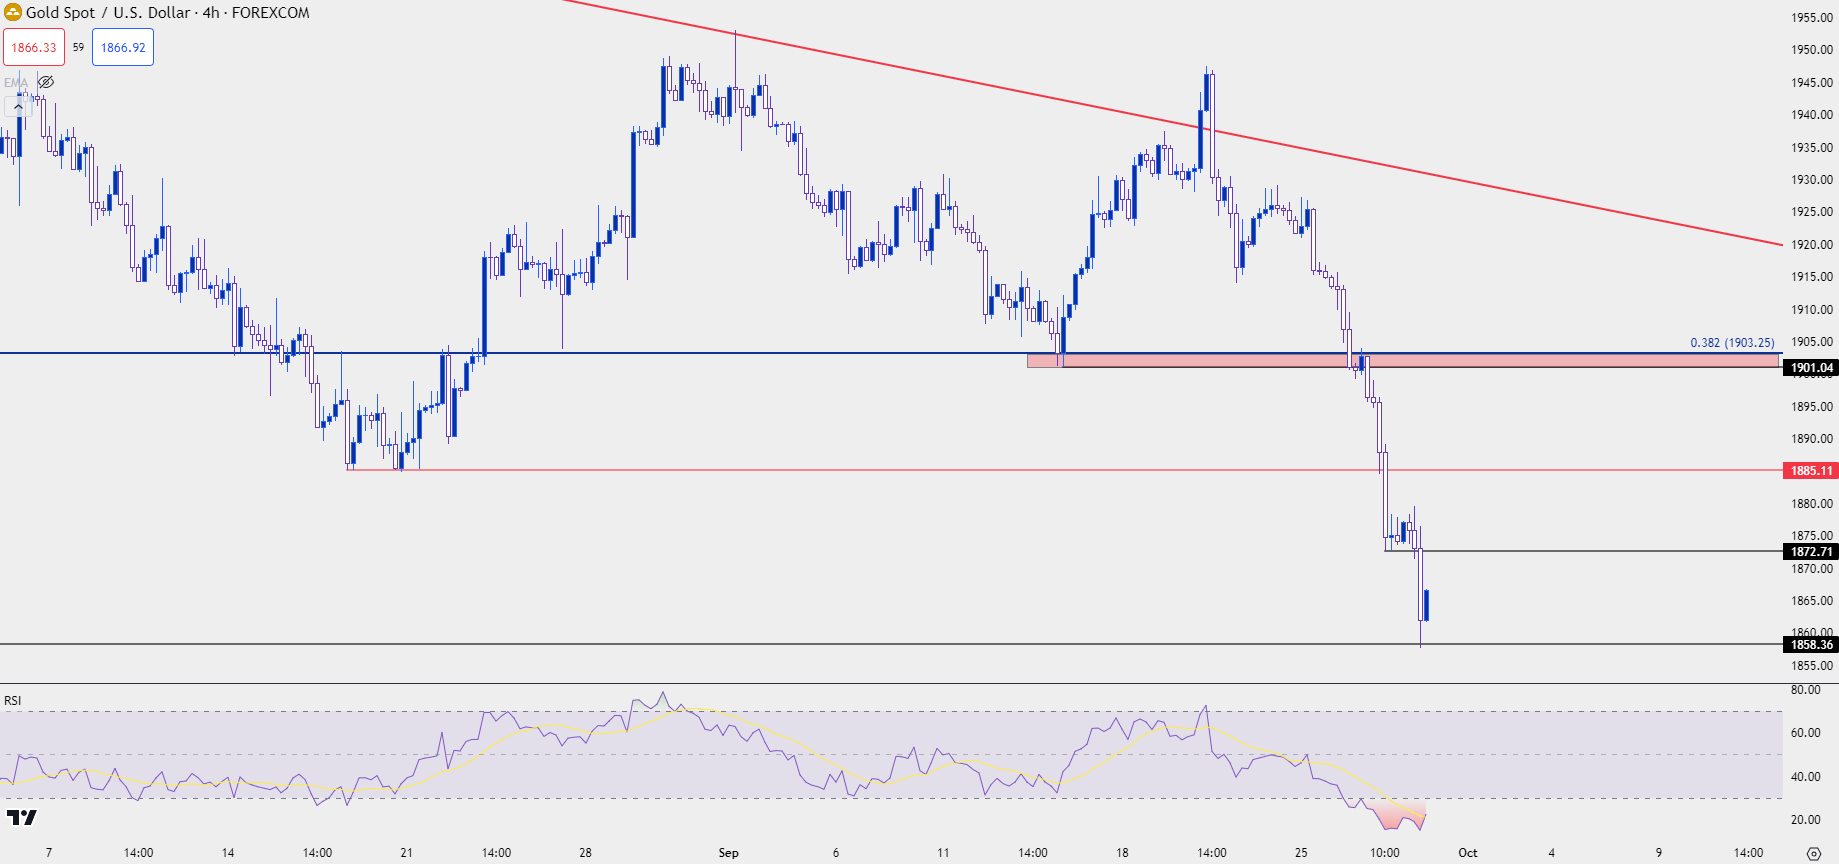
At this point gold prices are putting in bounce from that prior resistance swing at 1858. But the move driving into that was intense, and RSI on the daily chart went into oversold territory to signify just how hard that hit was in the week after FOMC. And from the four hour chart below, gold is still deeply in oversold territory which highlights that this might be a challenging time to chase that theme lower. To do so would suggest a continued slide-higher in both the USD and Treasury yields so, there may be scope for counter-trend behavior on that basis. So, the possibility remains for an oversold bounce to run a bit further, and this then begs the question as to where bears might ponder re-entry.
The 1885 level is an obvious spot as this was setting support in August and to date, there hasn’t been much for resistance there yet. Before that comes into play, another spot exists around 1872 which had shown some support when prices were sliding yesterday. If bears remain very aggressive this could be a spot to look for the lower-high.
And if the pullback does run for a bit longer than 1885, the prior spot of support, from around 1901-1903 could be looked at as an ‘r3’ type of resistance for pullback scenarios in spot gold.
Gold (XAU/USD) Four-Hour Price Chart

Chart prepared by James Stanley, Gold on Tradingview
--- written by James Stanley, Senior Strategist


