Gold, USD/CAD Talking Points:
- Gold prices continued their descent this week as the 1900 level came back into play, helping to provoke a late-week bounce.
- USD/CAD may be showing reversal potential, as price broke out of a falling wedge formation this week and then grasped on to a Fibonacci level to show higher-low support after bulls pulled back. Both Gold and USD/CAD could hold potential for scenarios of USD-strength as we move into Q3 and the second-half of 2023 trade.
- I’ll be discussing these themes in-depth in the weekly webinar on Tuesday at 1PM ET. It’s free for all to register: Click here to register.
Bears continued to drive in both Gold and USD/CAD as we opened into this week. In Gold, the prospect of more rate hikes out of the Fed kept bears in order as they were able to drive down for a test of the psychological level at 1900; whereas USD/CAD was holding on to a bearish break from the week before, helped along by a surprise rate hike out of the Bank of Canada earlier in the month that created a breach of a long-term spot of support.
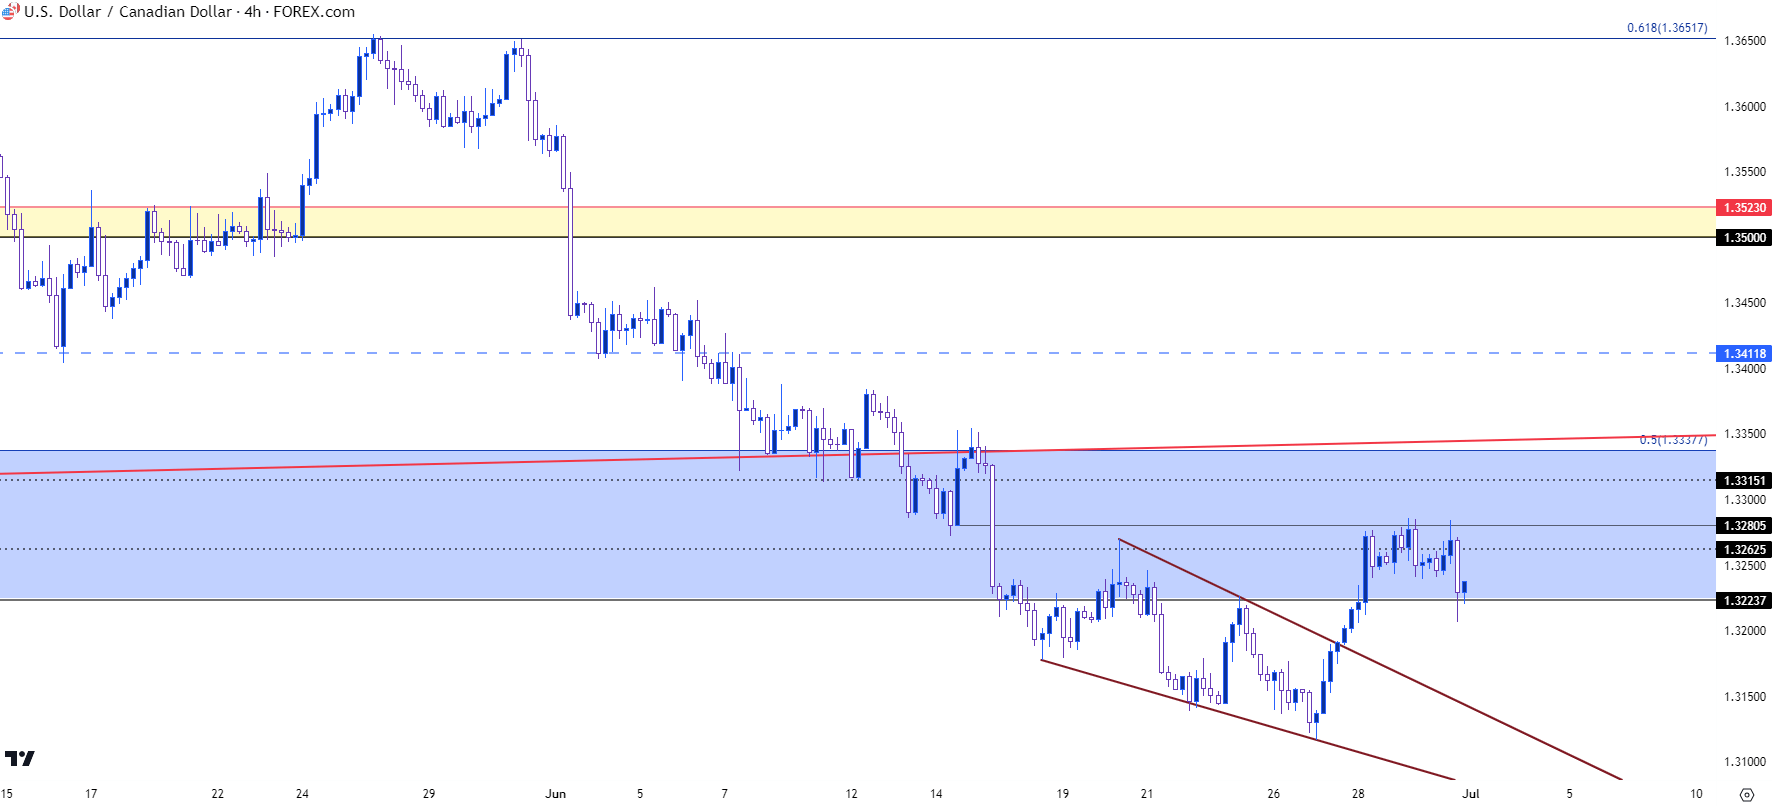
I looked into both themes during the Tuesday webinar, highlighting the build of a falling wedge formation in USD/CAD. Making the formation more interesting was where it had printed – just after a break of long-term support as bears had stalled while failing to continue the move. The exact chart that I drew that on during the webinar is below, and we can see that wedge breakout taking place a little later in the day, as buyers charged up for a re-test of the 1.3280 level.
Prices pulled back on Friday, but so far support has held around a key spot at 1.3224, which I’ve been tracking as the bottom of the USD/CAD support zone which we’ll look at in greater depth in the next chart.
The wedge breakout led to a fresh higher-high, and if we can get confirmation that the higher-low will hold then the door can remain open for bulls. The next spot of key resistance would be around the top of the longer-term support zone, around 1.3338, with a shorter-term level of interest around 1.3315.
USD/CAD Four-Hour Price Chart
 Chart prepared by James Stanley, USD/CAD on Tradingview
USD/CAD Longer-Term
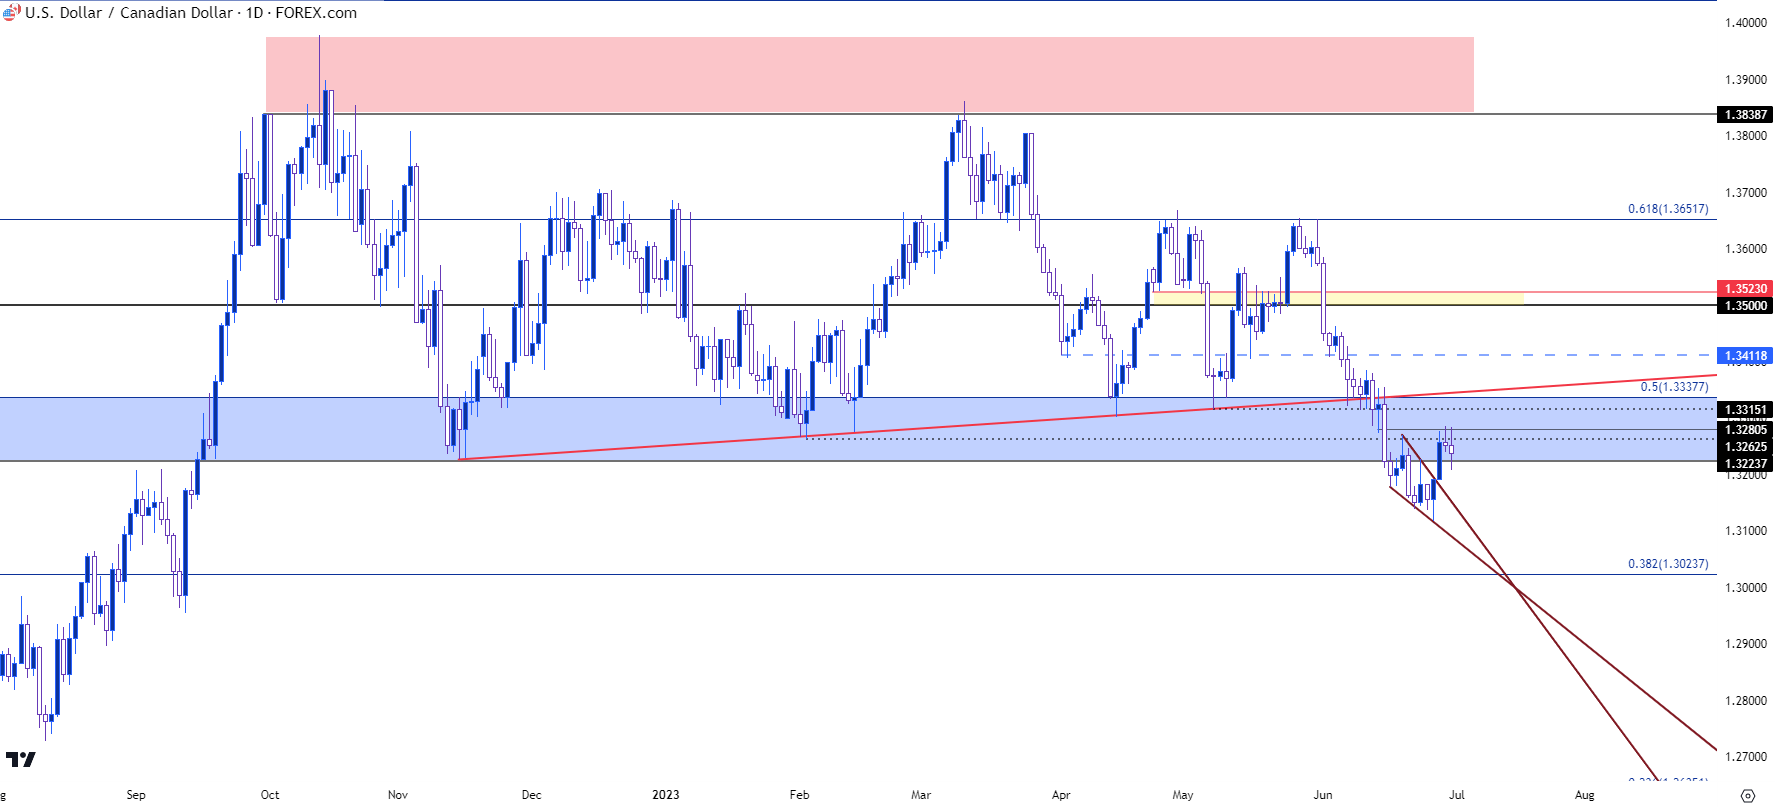
Taking a step back to the daily chart and that prior range comes back into view. The level at 1.3224 was a swing high last July, which came back into the picture to set a swing low in November. This was marking the lower bounds of support for a range that had been in-play for eight months. The upper portion of that support zone is derived from a Fibonacci level at 1.3338, and this provides some shorter-term structure to follow in effort of tracking whether bulls can force price back towards the median of that range-bound backdrop.
This would allude to longer-term resistance potential around 1.3412 and 1.3500. But the key will be a show of higher low support to keep the door open to that theme.
USD/CAD Daily Price Chart
 Chart prepared by James Stanley, USD/CAD on Tradingview
Spot Gold, XAU/USD
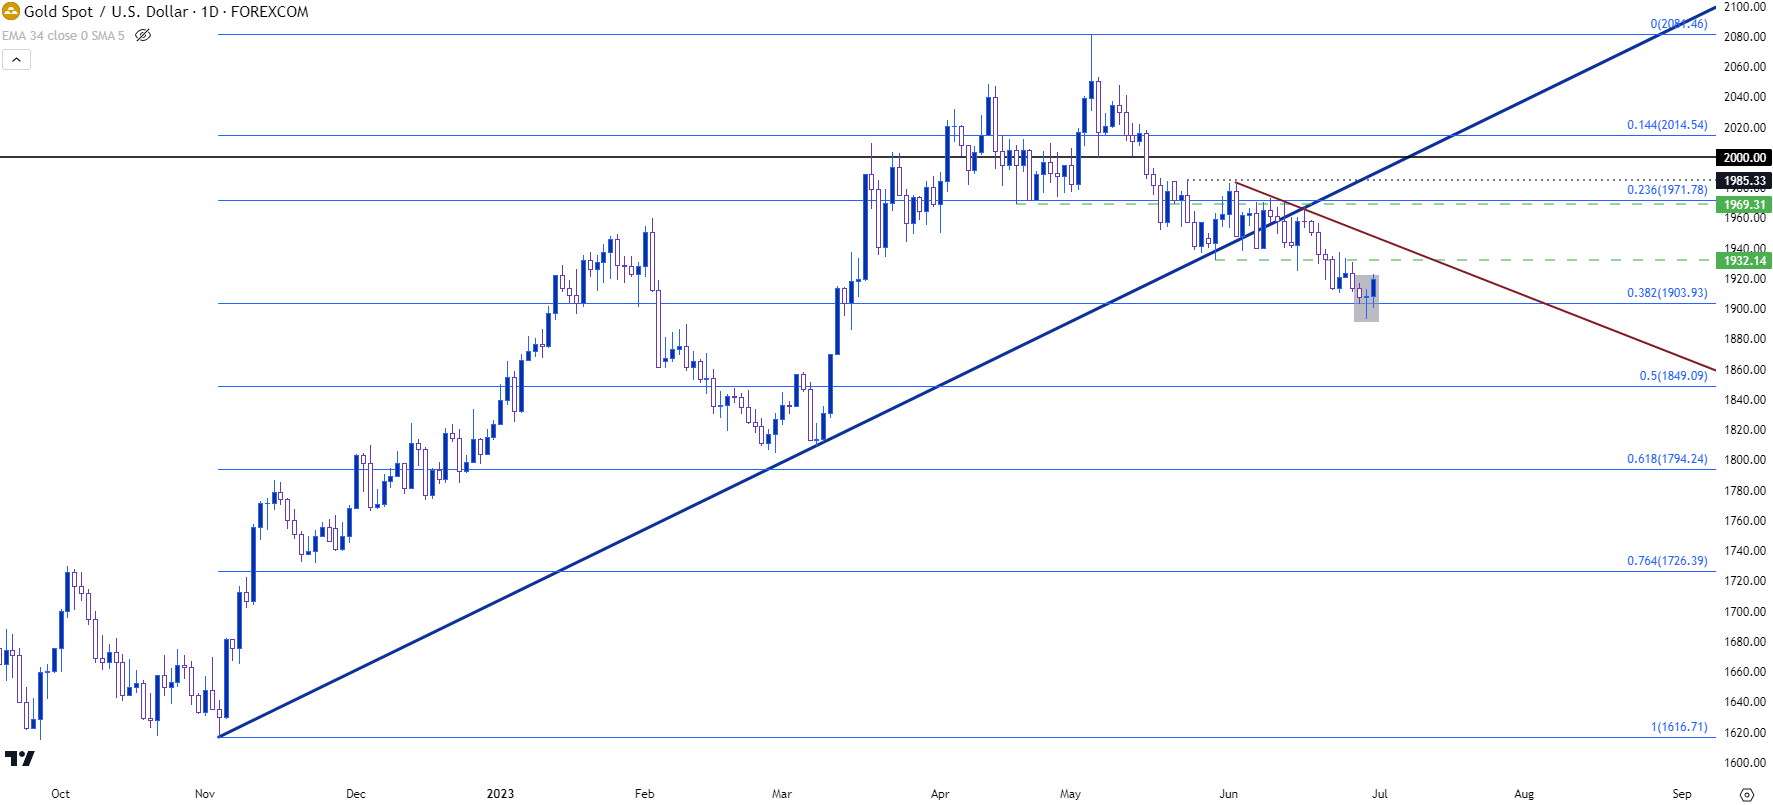
Gold prices continued their pullback move this week, setting a fresh three month low on Thursday. That entailed a test of the 38.2% Fibonacci retracement of the recent bullish move which plots around the 1900 psychological level. A shot of USD-weakness on Friday on the back of Core PCE numbers helped the pair to pullback from those lows, but bears appear to retain control as we’ve seen a continuation of both lower-lows and lower-highs.
On the other side of the argument: Bears have had an open door to push fresh lows for the past couple of weeks, and that bearish move has been relatively tepid. At this point, from the daily chart, Gold is working on a morning star pattern which is often approached with aim of bullish reversal. So, if buyers can continue to push, specifically through the 1932 level which was a spot of support-turned-resistance, there may be scope for a deeper pullback.
In spot Gold, that could point towards the 1971 Fibonacci level which had previously helped to hold the highs in early-June trade.
Spot Gold, XAU/USD Daily Chart
 Chart prepared by James Stanley, Gold on Tradingview
Gold Shorter-Term
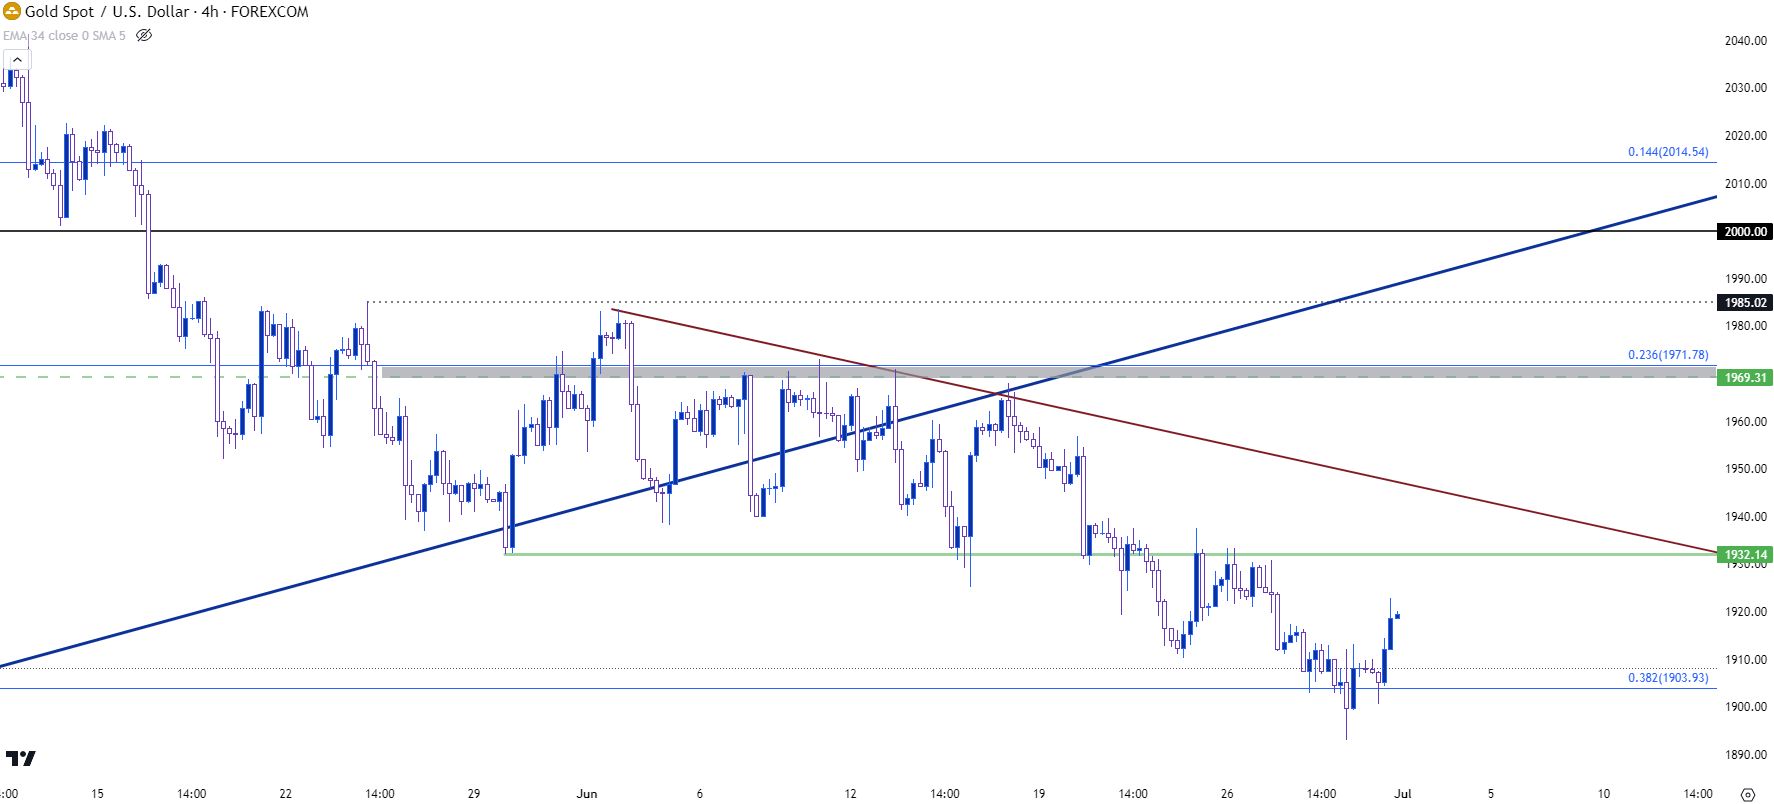
Gold has been a challenge for bears when holding at support, such as we saw with the 1900 level this week. The bigger question is how sellers react at resistance and whether buyers are able to force a move up to a fresh higher-high.
This puts focus on the 1932 level which had held the lows in late-May before showing a couple of support bounces in June until bears were finally able to run-through that level. There was a show of resistance there earlier in the week, so if buyers can push above that we’d have a fresh higher-high and that could keep the door open for bullish continuation scenarios. The next significant level sitting above price would be the 1971 Fibonacci level which had offered a few instances of resistance in early-June trade.
Spot Gold, XAU/USD Four-Hour Chart
 Chart prepared by James Stanley, Gold on Tradingview
--- written by James Stanley, Senior Strategist


