Gold Price Outlook: XAU/USD
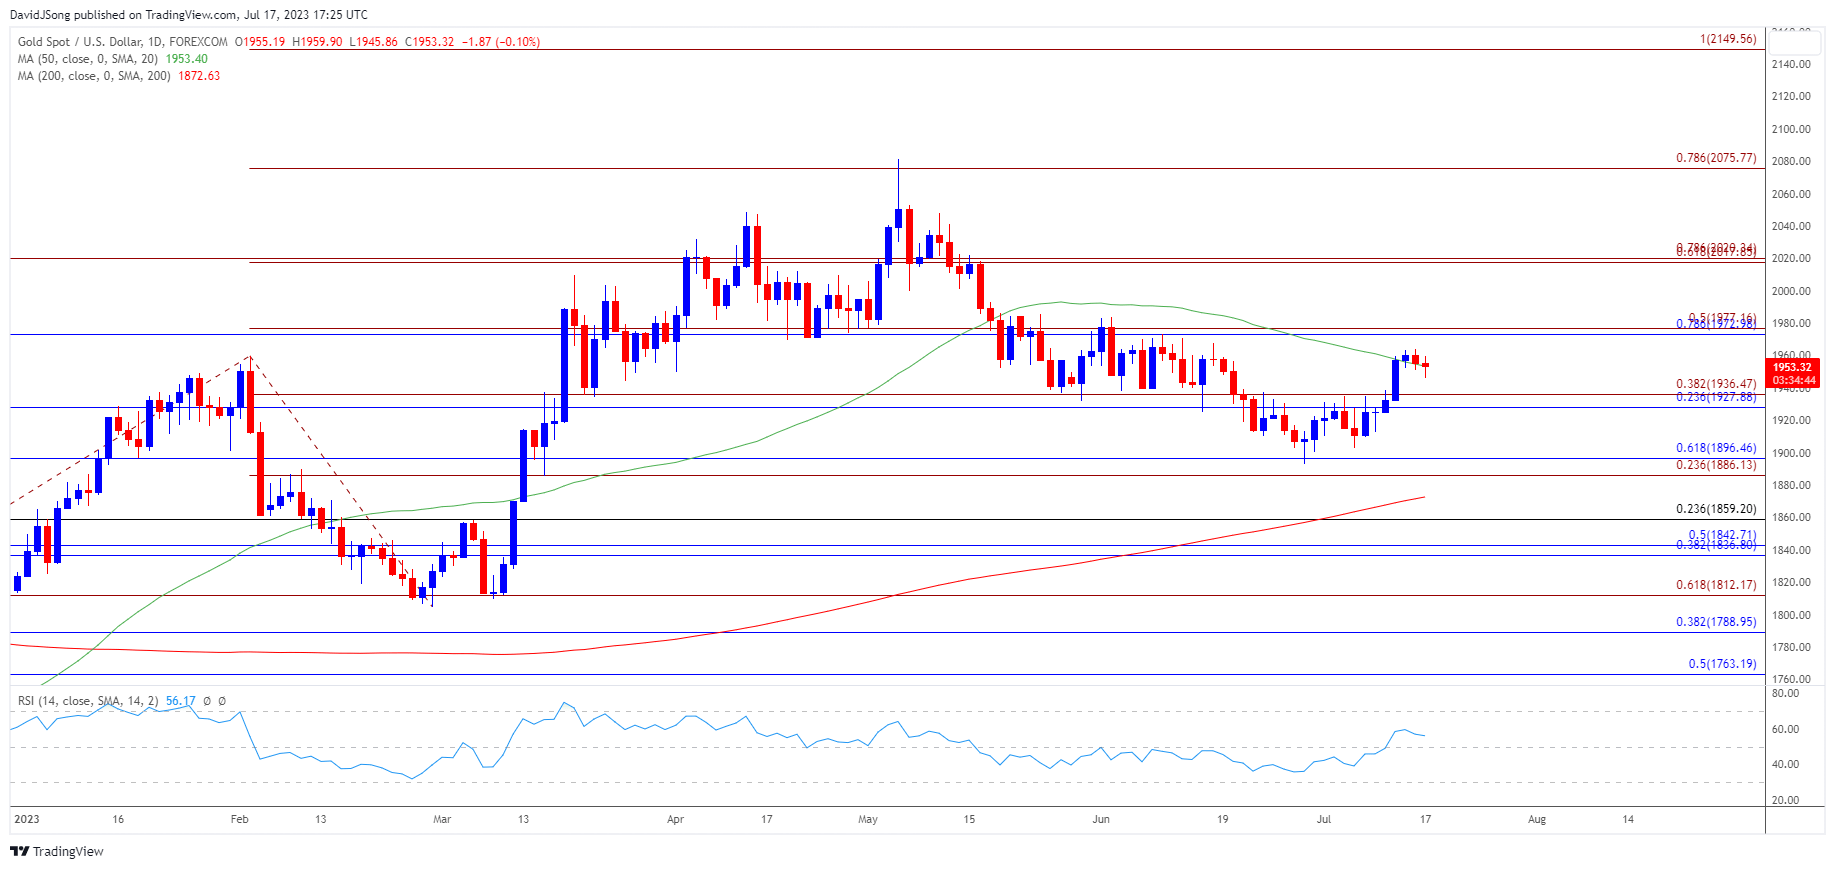
The price of gold gives back the advance from earlier this month after failing to test the June high ($1984), and bullion may track the negative slope in the 50-Day SMA ($1953) as it struggles to hold above the moving average.
Gold Price Vulnerable After Failing to Test June High
The price of gold initiates a series of lower highs and lows as it continues to pullback from the monthly high ($1964), and data prints coming out of the US may drag on the precious metal as the economy shows little signs of a recession.
Join David Song for the Weekly Fundamental Market Outlook webinar. David provides a market overview and takes questions in real-time. Register Here
US Economic Calendar

The US Retail Sales report is anticipated to show household spending increasing 0.5% in June following the 0.3% expansion the month prior, and a positive development may encourage the Federal Reserve to pursue a more restrictive policy as Governor Christopher Waller emphasizes that ‘the Summary of Economic Projections (SEP) signaled two additional rate hikes by the end of this year.’
As a result, the Federal Open Market Committee (FOMC) may continue to combat inflation by voting for a 25bp rate hike later this month, but a weaker-than-expected US Retail Sales report may push Chairman Jerome Powell and Co. to adjust the forward guidance for monetary policy amid signs of a slowing economy.

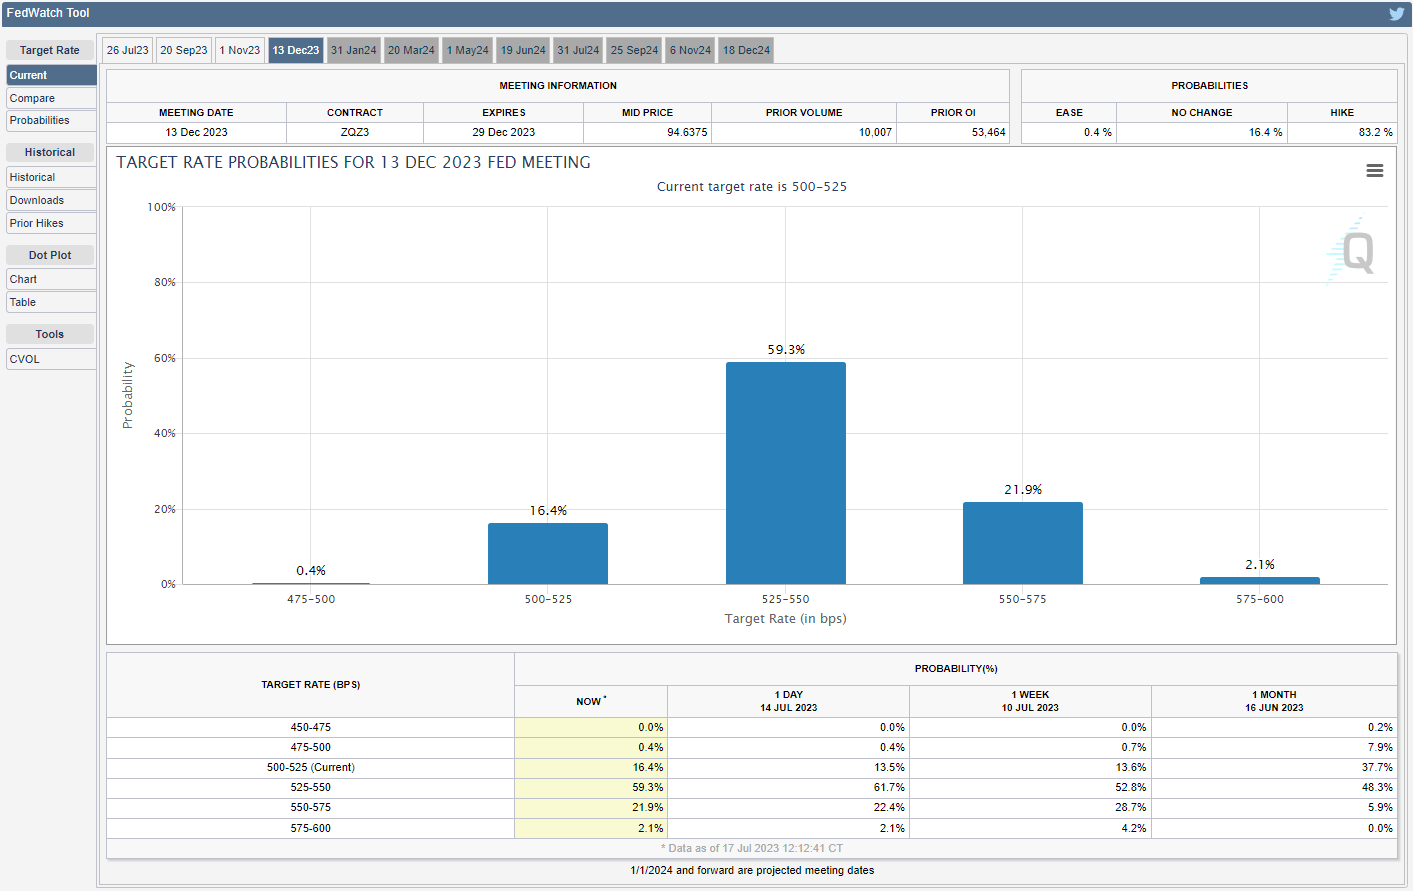
Source: CME
In turn, a dovish Fed rate-hike may heighten the appeal of gold as the CME FedWatch Tool now reflects a greater than 70% probability for a terminal rate of 5.25% to 5.50%, and speculation for an imminent change in regime may prop up bullion as the central bank sees inflation close to 2% in 2025.
With that said, expectations surrounding Fed policy may influence the price of gold as the central bank seems to be nearing the end of its hiking-cycle, but the precious metal may track the negative slope in the 50-Day SMA ($1953) as it appears to be reversing ahead of the June high ($1984).
Gold Price Chart – XAU/USD Daily

Chart Prepared by David Song, Strategist; Gold Price on TradingView
- The recent advance in the price of gold unravels following the failed attempt to test the June high ($1984), and the precious metal may track the negative slope in the 50-Day SMA ($1953) as it struggles to hold above the moving average.
- Failure to hold above the $1928 (23.6% Fibonacci retracement) to $1937 (38.2% Fibonacci extension) region may push the price of gold towards the monthly low ($1903), with the next area of interest coming in around $1886 (23.6% Fibonacci extension) to $1897 (61.8% Fibonacci retracement), which includes the June low ($1893).
- Nevertheless, a move above the $1973 (78.6% Fibonacci retracement) to $1977 (50% Fibonacci extension) region may lead to a test of the June high ($1984), with the next area of interest coming in around $2018 (61.8% Fibonacci extension) to $2020 (78.6% Fibonacci extension).
Additional Market Outlooks:
British Pound Forecast: GBP/USD Bull Flag Formation Unfolds
USD/CAD Reveres Ahead of 50-Day SMA to Snap July Opening Range
--- Written by David Song, Strategist
Follow on Twitter at @DavidJSong


