Gold Price Outlook
Fresh data prints coming out of the US may fuel the recent rebound in the price of gold as the Durable Goods Orders report is anticipated to show a slowing economy, but the precious metal may face headwinds over the remainder of the month as it struggles to trade back above the former-support zone around the May low ($1932).
Gold Price Struggles to Push Above Former Support
The price of gold continues to bounce back from a fresh monthly low ($1910) while US Treasury yields weaken for the second consecutive day, and speculation surrounding the Federal Reserve may sway the precious metal as Chairman Jerome Powell prepares US lawmakers for higher interest rates.
Join David Song for the Weekly Fundamental Market Outlook webinar. Register Here

However, the update to the Durable Goods Orders report may limit the Fed’s scope to implement a more restrictive policy as demand for large-ticket items is expected to contract 1.0% in May, while Non-Defense Capital Goods Orders excluding Aircrafts, a proxy for business investment, is projected to hold flat during the same period.
Signs of a slowing economy may heighten the appeal of gold as it encourages the Federal Open Market Committee (FOMC) to retain the current policy, but a better-than-expected Durable Goods Orders report may drag on bullion as it fuels speculation for a Fed rate hike at the next interest rate decision on July 26.
With that said, developments coming out of the US may influence the price of gold as Chairman Powell and Co. forecast a steeper path for the Fed Funds rate, but the recent rebound in bullion may end up being short-lived as it struggles to trade back above the former-support zone around the May low ($1932).
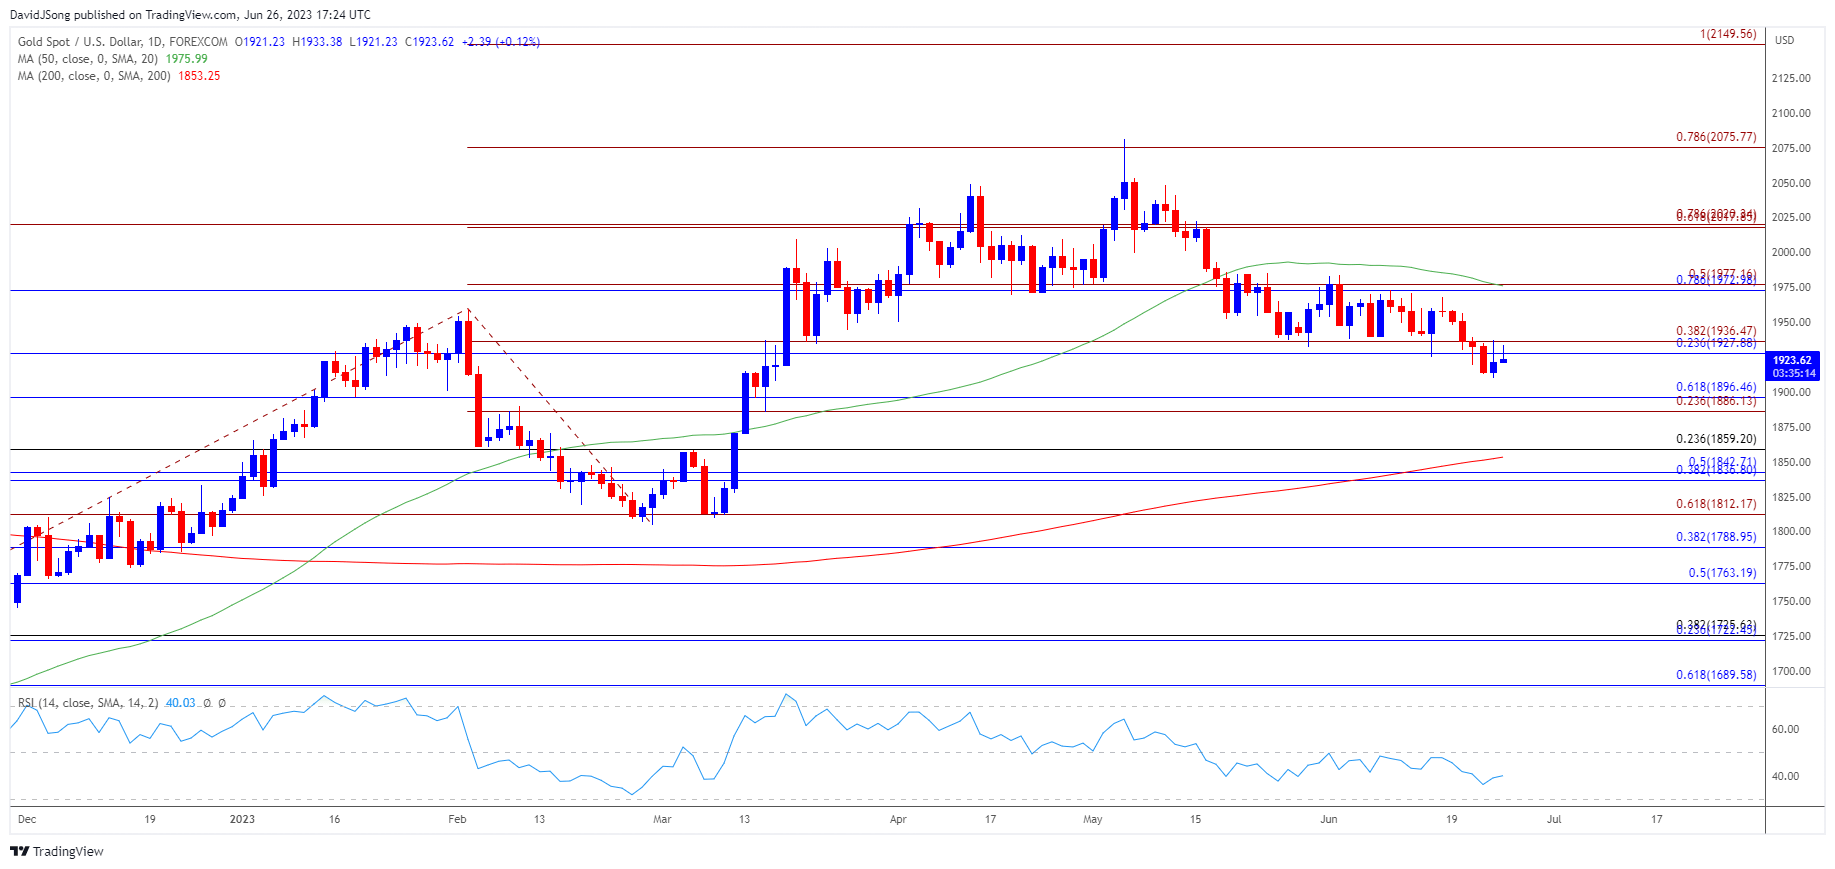
Gold Price Chart – XAU/USD Daily

Chart Prepared by David Song, Strategist; Gold Price on TradingView
- The price of gold may attempt to extend the rebound from the monthly low ($1910) as it appears to be reversing ahead of the $1886 (23.6% Fibonacci extension) to $1897 (61.8% Fibonacci retracement) region, with a move above the $1928 (23.6% Fibonacci retracement) to $1937 (38.2% Fibonacci extension) area bringing the $1973 (78.6% Fibonacci retracement) to $1977 (50% Fibonacci extension) zone back on the radar, which lines up with the 50-Day SMA ($1976).
- However, failure to trade back above the former-support zone around the May low ($1932) may curb the recent rebound in the price of gold as the moving average starts to reflect a negative slope, and lack of momentum to close above the $1928 (23.6% Fibonacci retracement) to $1937 (38.2% Fibonacci extension) area may push bullion towards the $1886 (23.6% Fibonacci extension) to $1897 (61.8% Fibonacci retracement) region.
- Next zone of interest comes in around $1859 (23.6% Fibonacci retracement), with a move below the 200-Day SMA ($1853) opening up the $1837 (38.2% Fibonacci retracement) to $1843 (50% Fibonacci retracement) area.
Additional Resources:
EUR/USD Fails to Test May High as Fed Officials Defend Higher Rates
USD/CAD Weakness Triggers Another Oversold RSI Reading
--- Written by David Song, Strategist
Follow on Twitter at @DavidJSong


