Gold Price Outlook
The price of gold carves a series of higher highs and lows following the failed attempt to test the February low ($1805), and the failure of Silicon Valley Bank (SVB) may continue to heighten the appeal of bullion as market participants scale back bets for higher US interest rates.
Gold price rallies as SVB failure casts doubt for Fed rate hikes
The price of gold trades back above the 50-Day SMA ($1872) as it rallies to a fresh monthly high ($1913), and the precious metal may once again track the positive slope in the moving average as fears surrounding the US banking sector drags on risk-taking behavior.
As a result, the threat of contagion may lead to a flight to safety even as the Federal Reserve announces that ‘it will make available additional funding to eligible depository institutions to help assure banks have the ability to meet the needs of all their depositors,’ and it remains to be seen if the Federal Open Market Committee (FOMC) will adjust the forward guidance for monetary policy as central bank is slated to release the updated Summary of Economic Projections (SEP) on March 22.

Source: CME
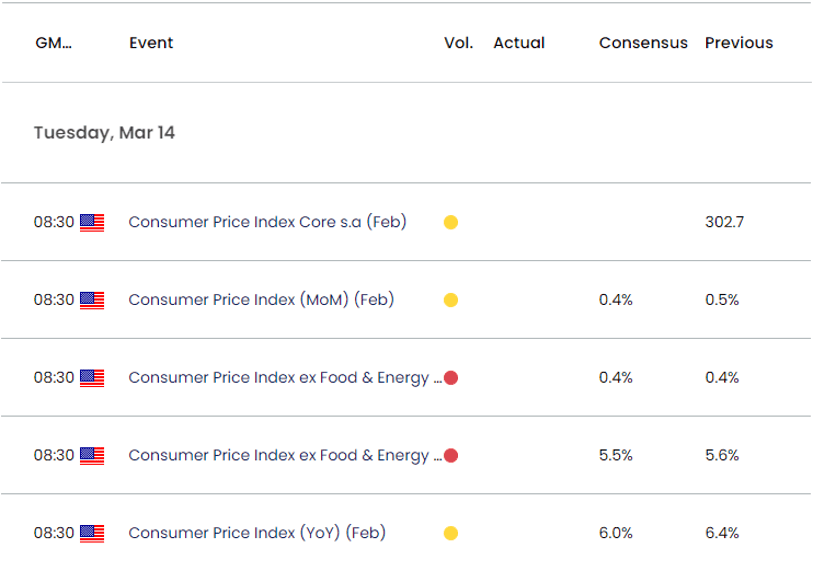
Until then, the price of gold may continue to retrace the decline from the February high ($1960) as the CME FedWatch Tool now reflects a greater than 90% probability for a terminal rate of 4.75% to 5.00%, and developments coming out of the US may keep the precious metal afloat as the update to the US Consumer Price Index (CPI) is anticipated to show slowing inflation.
Join David Song for the next Live Economic Coverage webinar to cover the update to the US Consumer Price Index (CPI) on Tuesday, March 14. Register Here

Both the headline and core CPI are expected to narrow in February following the stronger-than-expected reading during the previous period, and evidence of easing price growth may fuel the recent rally in gold as it puts pressure on Chairman Jerome Powell and Co. to conclude the hiking-cycle.
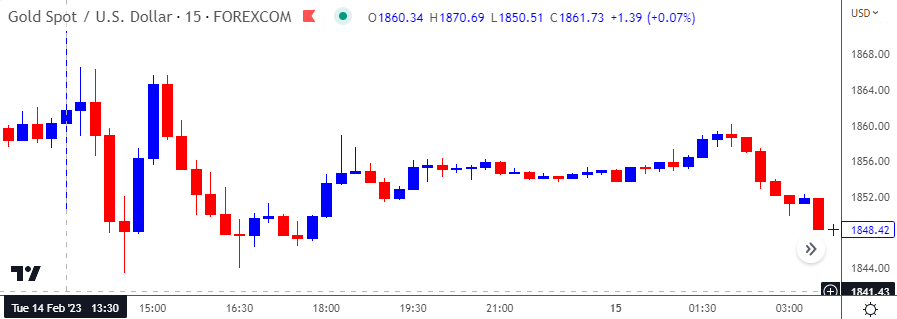
Gold Price 15-Minute Chart: February 14, 2023

However, another stronger-than-expected CPI report may lead to a kneejerk reaction in bullion like the price action seen last month, and the FOMC may keep the door open to pursue a more restrictive policy as the Non-Farm Payrolls (NFP) report shows the US economy adding 311K jobs in February.
With that said, speculation surrounding the US monetary policy outlook may continue to influence the price of gold as inflation remains well above the Fed’s 2% target, but the precious metal may continue to retrace the decline from the February high ($1960) as it extends the series of higher highs and lows from last week.
Gold Price Chart – XAU/USD Daily

Chart Prepared by David Song, Strategist; Gold Price on TradingView
- The price of gold trades back above the 50-Day SMA ($1872) after reversing ahead of the February low ($1805), and bullion may once again track the positive slope in the moving average as it breaks out of the opening range for March.
- The recent series of higher highs and lows in the price of gold may push the Relative Strength Index (RSI) into overbought territory, with a move above 70 in the oscillator likely to be accompanied by a further advance in price like the behavior seen earlier this year.
- The move above $1897 (61.8% Fibonacci retracement) brings the $1928 (23.6% Fibonacci retracement) region on the radar, with a move above the February high ($1960) opening up the $1973 (78.6% Fibonacci retracement) area.
- However, lack of momentum to test the $1928 (23.6% Fibonacci retracement) region may undermine the recent rally in the price of gold, with a move below the 50-Day SMA ($1872) raising the scope for a run at $1859 (23.6% Fibonacci retracement).
--- Written by David Song, Strategist
Follow me on Twitter at @DavidJSong


