Gold Price Outlook
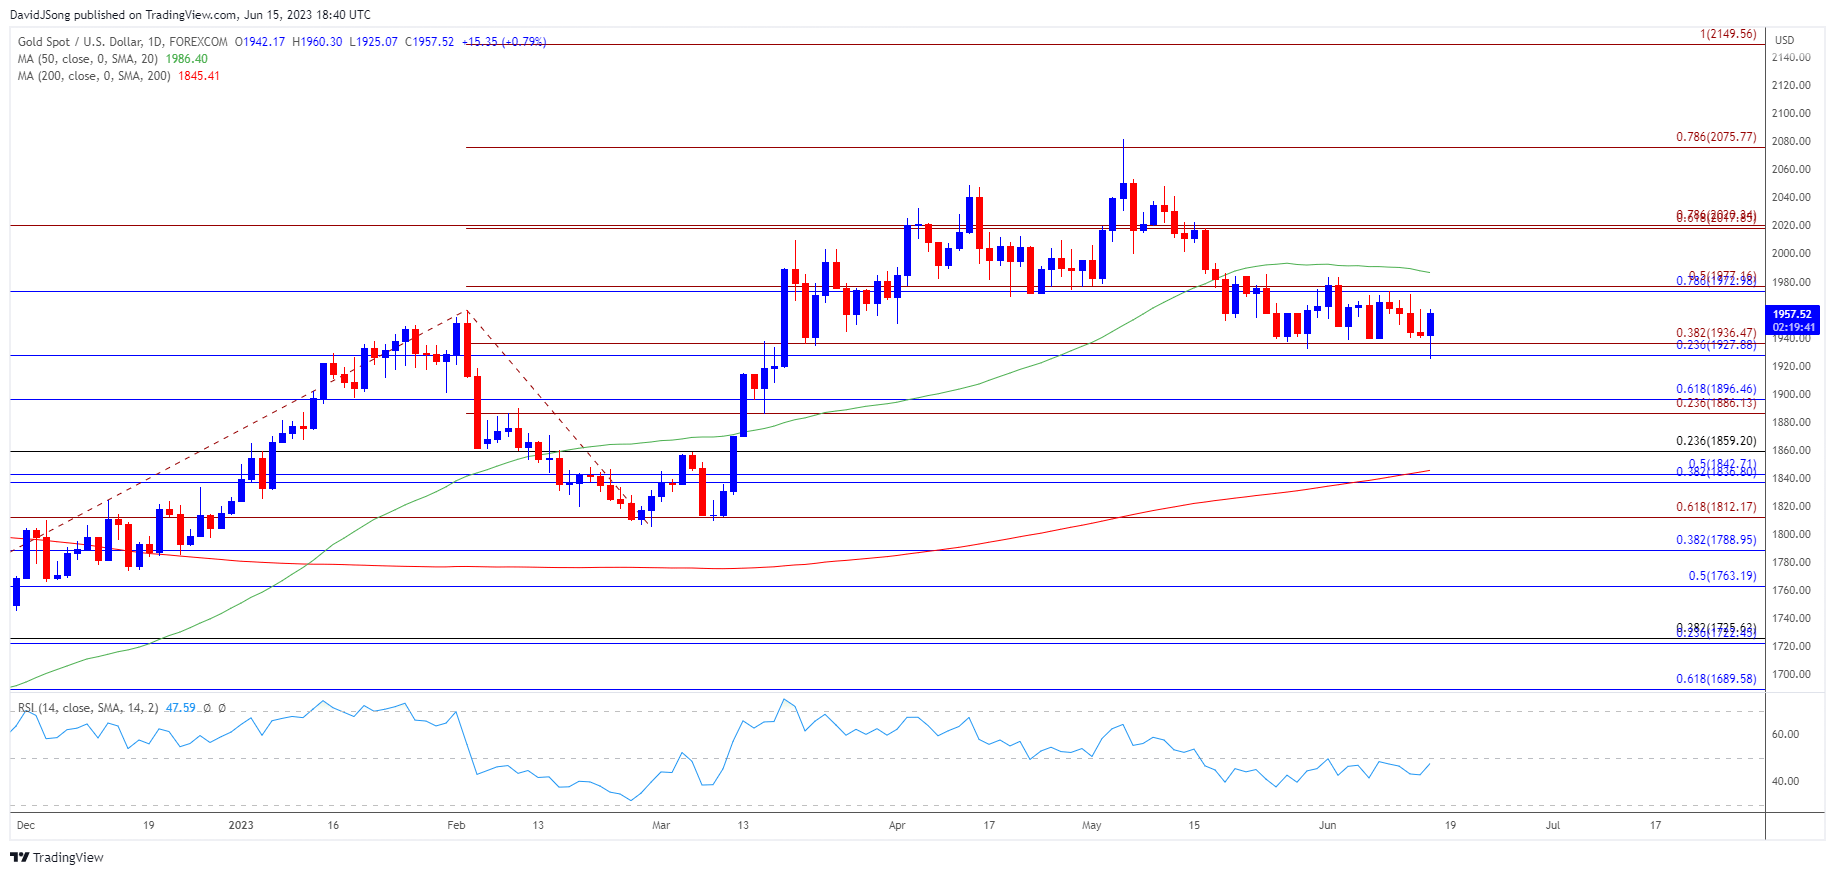
The price of gold carves a bullish outside day (engulfing) candlestick formation as it retraces the decline following the Federal Reserve interest rate decision, but failure to push back above the 50-Day SMA ($1987) may curb the rebound in bullion as the moving average no longer reflects a positive slope.
Gold Price Pending Test of 50-Day SMA amid Bullish Outside Day
Bullion appears to be unfazed by the 0.3% rise in US Retail Sales as it carves as it bounces back from a fresh monthly low ($1925), with the recovery in the price of gold coinciding with the recent weakness in US Treasury yields as the market participants seem unconvinced the Fed will pursue a more restrictive policy.
Join David Song for the Weekly Fundamental Market Outlook webinar. Register Here

Source: CME
According to the CME FedWatch Tool, US interest rates are expected to be unchanged by the end of the year as market participants price a 50% chance of seeing the Fed Funds rate at 5.00% to 5.25% in December.

As a result, the U. of Michigan Confidence Survey may do little to influence the price of gold even though the update is anticipated to show the index rising to 60.0 in June from 59.2 the month prior, but an improvement in consumer sentiment may push the Federal Open Market Committee (FOMC) to reestablish its hiking-cycle as Chairman Jerome Powell and Co. project a steeper path for US interest rates.
In turn, the price of gold may face headwinds ahead of the next Fed rate decision on July 26 as data prints coming out of the US show little indications of a looming recession, and it remains to be seen if Fed officials will continue to adjust the forward guidance as inflation remains above the central bank’s 2% target.
With that said, recent price action may lead to a larger rebound in gold as it carves a bullish outside day (engulfing) candlestick formation, but failure to push back above the 50-Day SMA ($1987) may curb the rebound in the price of bullion as the moving average no longer reflects a positive slope.
Gold Price Chart – XAU/USD Daily

Chart Prepared by David Song, Strategist; Gold Price on TradingView
- The price of gold carves a bullish outside day (engulfing) candlestick formation as it bounces back from a fresh monthly low ($1925), and lack of momentum to close below the $1928 (23.6% Fibonacci retracement) to $1937 (38.2% Fibonacci extension) area may push bullion back towards the $1973 (78.6% Fibonacci retracement) to $1977 (50% Fibonacci extension) zone.
- A move above the monthly high ($1984) may spur a run at the 50-Day SMA ($1986), but failure to trade back above the moving average may curb the rebound in the price of bullion as the indicator no longer reflects a positive slope.
- In turn, failure to push above the $1973 (78.6% Fibonacci retracement) to $1977 (50% Fibonacci extension) zone may bring the $1928 (23.6% Fibonacci retracement) to $1937 (38.2% Fibonacci extension) area back on the radar, with the next area of interest coming in around $1886 (23.6% Fibonacci extension) to $1897 (61.8% Fibonacci retracement).
Additional Market Outlooks
USD/JPY Post-Fed Rebound Brings BoJ Rate Decision in Focus
AUD/USD Forecast: Post-RBA Rally Eyes May High
--- Written by David Song, Strategist
Follow on Twitter at @DavidJSong


