Gold Price Outlook: XAU/USD
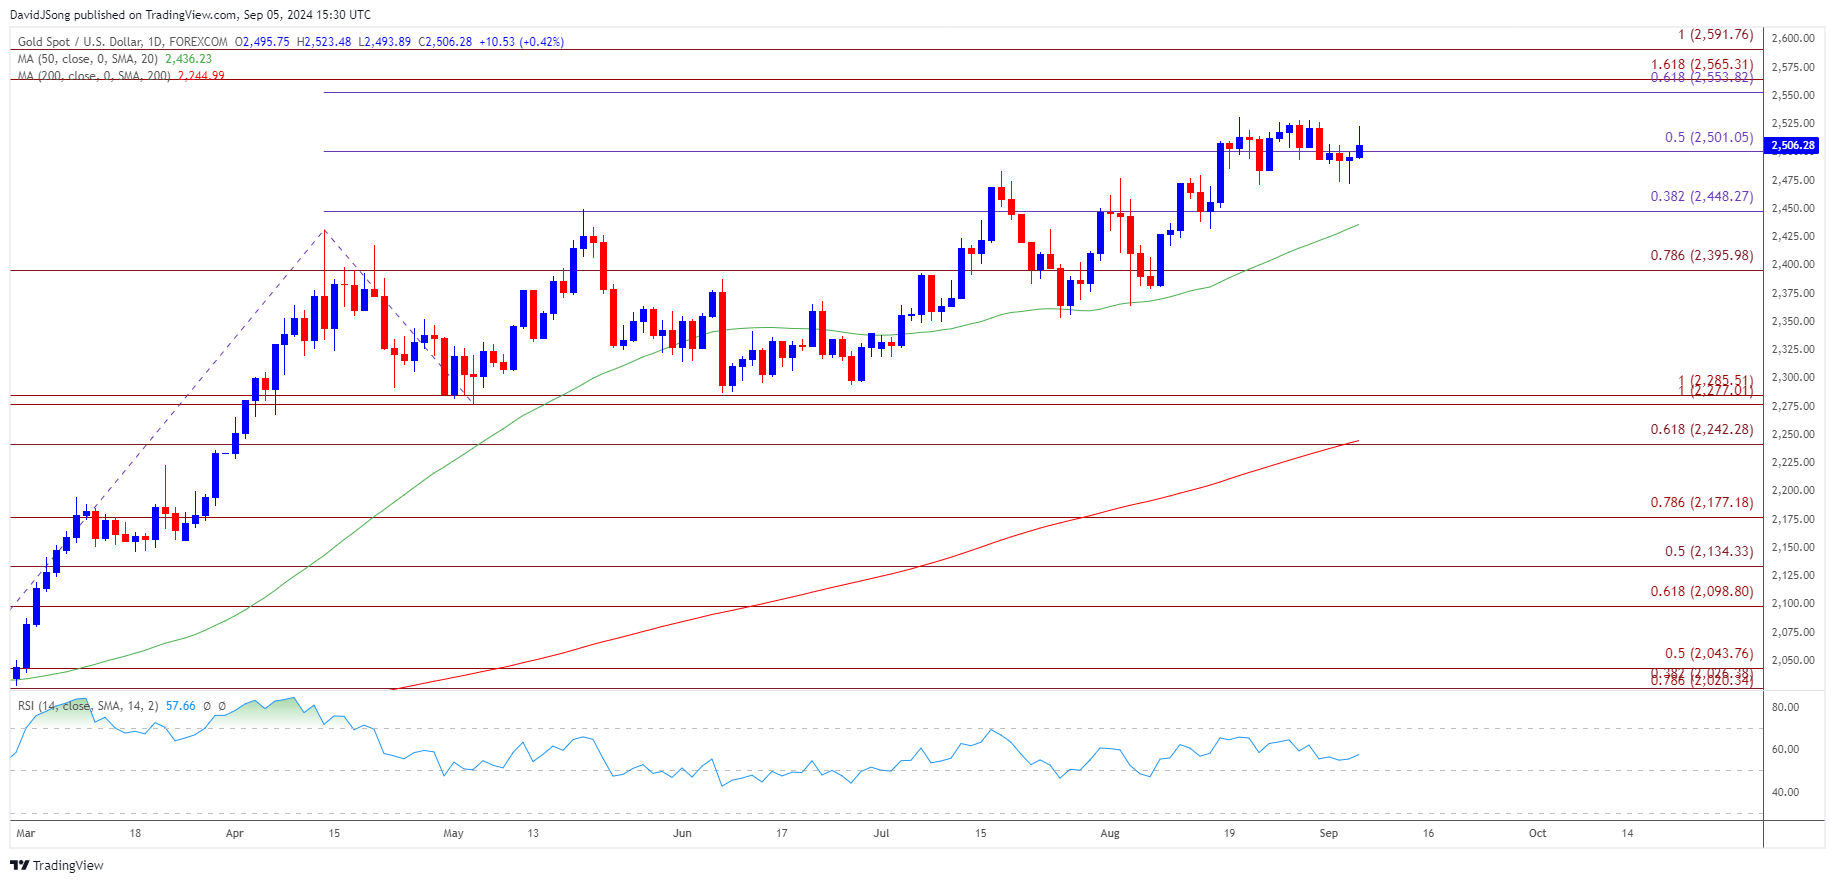
The price of gold may track the positive slope in the 50-Day SMA ($2436) as it appears to be bouncing back ahead of the moving average.
Gold Price Forecast: XAU/USD Pullback Keeps RSI Below 70
The price of gold may attempt to test the yearly high ($2532) as it extends the rebound from the weekly low ($2472), and the threat of a policy error by major central banks may keep the precious metal afloat as it represents an alternative to fiat-currencies.
Join David Song for the Weekly Fundamental Market Outlook webinar. David provides a market overview and takes questions in real-time. Register Here
However, the price of gold may face range bound conditions as ahead of the Federal Reserve interest rate decision on September 18 as the ISM Services Purchasing Manager Index (PMI) unexpectedly climbs to 51.5 in August from 51.4 the month prior, with the Prices Paid index also widening to 57.3 from 57.0 during the same period.
Little evidence of a looming recession may encourage the Federal Open Market Committee (FOMC) to further combat inflation, and it remains to be seen if the central bank will implement a series of rate-cuts as Chairman Jerome Powell insists that ‘the time has come for policy to adjust.’
US Economic Calendar

In turn, the update to the Non-Farm Payrolls (NFP) may sway the FOMC as the US economy is anticipated to add 160K jobs in August, while Average Hourly Earnings are seen widening to 3.7% from 3.6% during the same period.
A pickup in job growth may limit the Fed’s ability to pursue a rate-cutting cycle, and a signs of a resilient labor market may drag on the price of gold as ‘the timing and pace of rate cuts will depend on incoming data.’
With that said, the price of gold may struggle to retain the rebound from the weekly low ($2472), but another weaker-than-expected NFP print may heighten the appeal of bullion as it fuels speculation for a material shift in Fed policy.
XAU/USD Price Chart – Daily

Chart Prepared by David Song, Strategist; XAU/USD on TradingView
- The price of gold may further retrace the decline from the August high ($2532) as snaps the recent series of lower highs and lows, and bullion may reestablish the bullish trend from earlier this year should it track the positive slope in the 50-Day SMA ($2436).
- A breach above the August high ($2532) brings the $2550 (61.8% Fibonacci extension) to $2570 (161.8% Fibonacci extension) region back on the radar, with the next hurdle coming in around $2590 (100% Fibonacci extension).
- However, failure to test the August high ($2532) may keep the price of gold within a last month’s range, with a move below $2450 (38.2% Fibonacci extension) opening up $2400 (78.6% Fibonacci extension).
Additional Market Outlooks
US Non Farm Payrolls (NFP) Report Preview (AUG 2024)
Euro Forecast: EUR/USD Opening Range for September in Focus
US Dollar Forecast: USD/JPY Rally Persists After Defending Weekly Low
Canadian Dollar Forecast: USD/CAD Rebound Emerges Ahead of March Low
--- Written by David Song, Strategist
Follow on Twitter at @DavidJSong


