Gold Price Outlook
The price of gold consolidates following the failed attempt to trade back above the 50-Day SMA ($1990), and the precious metal may track the monthly range ahead of the Federal Reserve interest rate decision on June 14 as it pulls back from a fresh weekly high ($1973).
Gold Price Outlook Hinges on Fed Rate Decision
The price of gold may continue to face range bound conditions as the moving average no longer reflects a positive slope, but developments coming out of US may sway the precious metal as the US Consumer Price Index (CPI) is anticipated to show persistent inflation.
Join David Song for the Weekly Fundamental Market Outlook webinar. Register Here

Looking ahead, the core CPI is expected to increase to 5.6% in May from 5.5% per annum the month prior, and signs of sticky price growth may drag on the price of gold as it puts pressure on the Federal Reserve to further combat inflation.
As a result, the Federal Open Market Committee (FOMC) may deliver another 25bp rate hike as the 339K rise in US Non-Farm Payrolls (NFP) reflects a strong labor market, and it remains to be seen if Chairman Jerome Powell and Co. will adjust the forward guidance for monetary policy as the central bank is slated to update the Summary of Economic Projections (SEP).

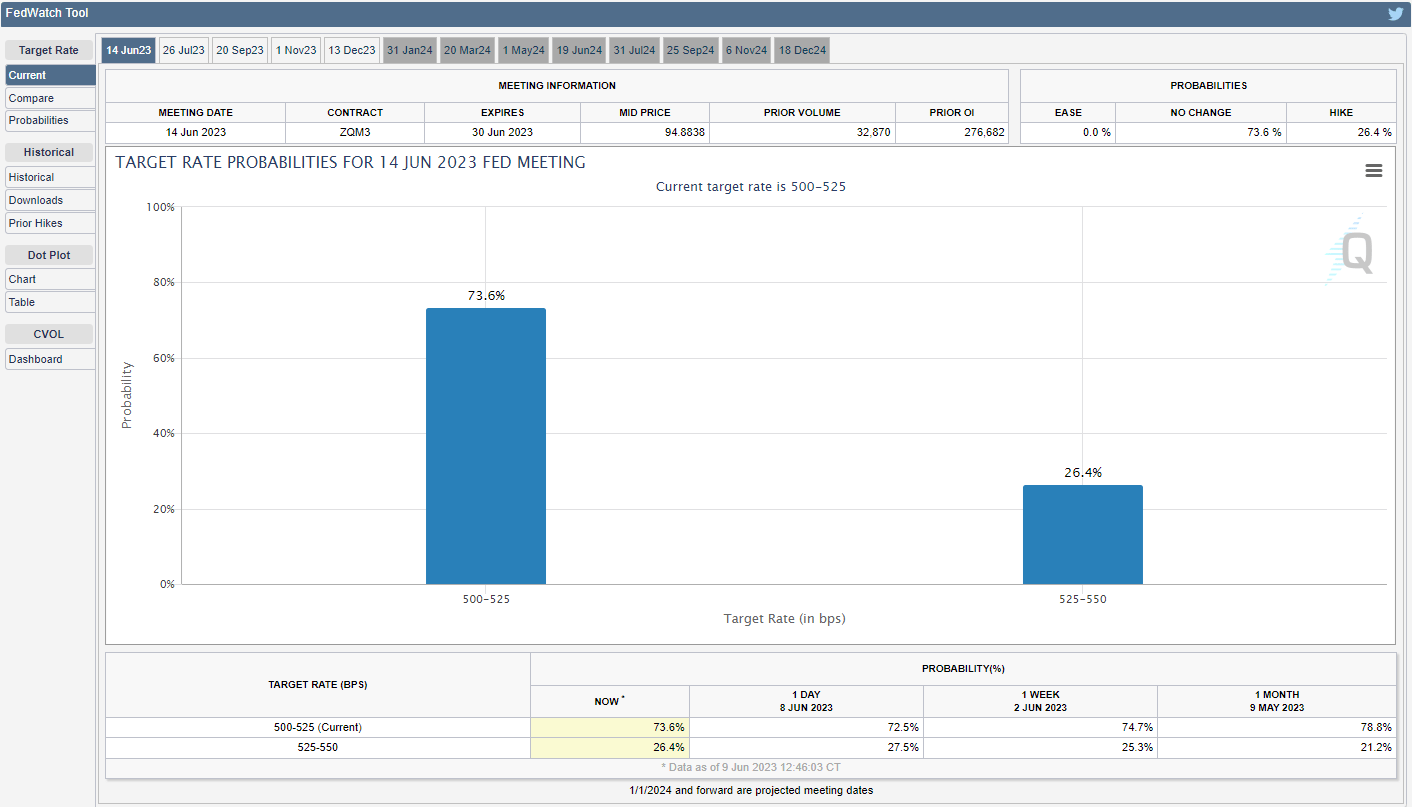
Source: CME
However, speculation for a change in Fed policy may keep gold prices afloat as the CME FedWatch Tool shows limited expectations for higher US interest rates, with market participants pricing a greater than 70% chance of seeing the FOMC move to the sidelines.
With that said, the price of gold may face range bound conditions ahead of the Fed rate decision as it appears to be tracking the flat slope in the 50-Day SMA ($1990), but developments coming out of the US may sway the near-term outlook for the price of gold as the central bank appears to be at or nearing the end of its hiking-cycle.
Gold Price Chart – XAU/USD Daily

Chart Prepared by David Song, Strategist; Gold Price on TradingView
- The price of gold seems to be stuck in a narrow range after struggling to push back above the 50-Day SMA ($1990), and bullion may continue to consolidate as the moving average no longer reflects a positive slope.
- Need a move above the $1973 (78.6% Fibonacci retracement) to $1977 (50% Fibonacci extension) zone to see another run at the moving average, with a move above the indicator bringing the $2018 (61.8% Fibonacci extension) to $2020 (78.6% Fibonacci extension) region back on the radar.
- However, failure to defend the monthly range may push the price of gold below the $1928 (23.6% Fibonacci retracement) to $1937 (38.2% Fibonacci extension) area, with the next region of interest coming in around $1886 (23.6% Fibonacci extension) to $1897 (61.8% Fibonacci retracement).
Additional Resources:
USD/JPY Ranges in Ascending Channel After Failing to Test May High
EUR/USD Outlook: June Opening Range Intact For Now
--- Written by David Song, Strategist
Follow me on Twitter at @DavidJSong


