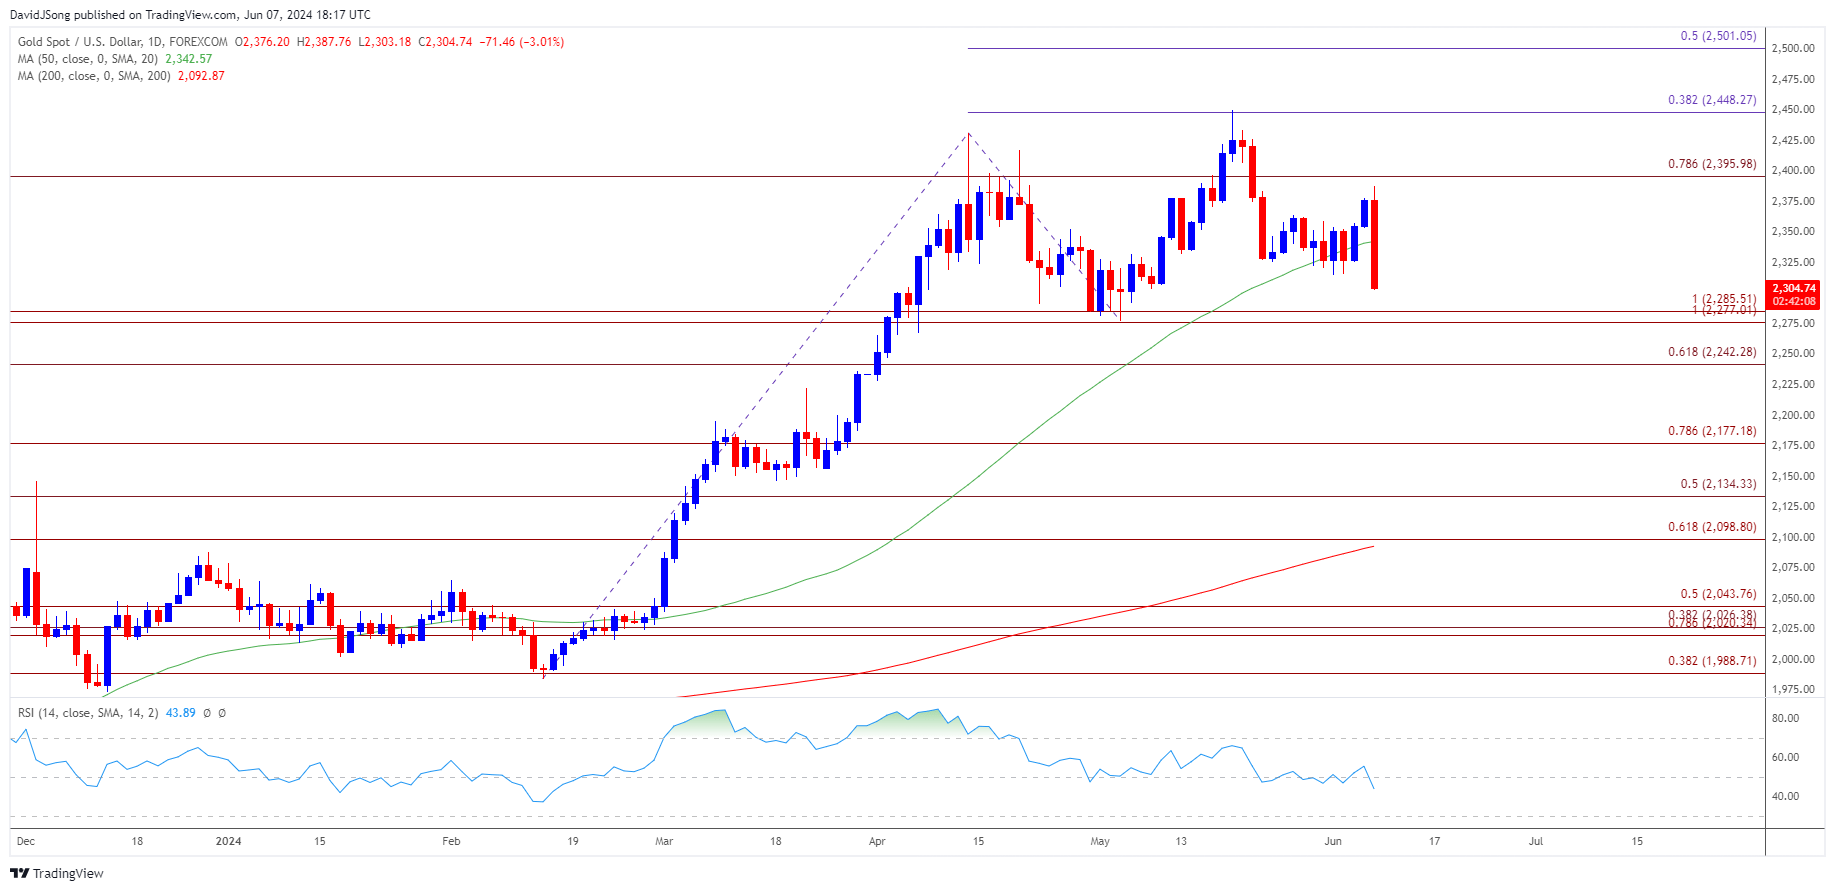
Gold Price Outlook: XAU/USD
The price of gold pulls back from a fresh monthly high ($2388) as the US Non-Farm Payrolls (NFP) report reveals a larger-than-expected rise in employment, but bullion may face range bound conditions if it continues to hold above the May low ($2277).
Gold Price Outlook Hinges on Fed Rate Decision
The price of gold registers a fresh weekly low ($2303) as the US adds 272K jobs in May versus forecasts for a 185K rise, and the precious metal may continue to weaken ahead of the Federal Reserve interest rate decision on June 12 as it struggles to track the positive slope in the 50-Day SMA ($2342).
Join David Song for the Weekly Fundamental Market Outlook webinar. David provides a market overview and takes questions in real-time. Register Here
Looking ahead, the Federal Open Market Committee (FOMC) is widely expected to retain the current policy as the central bank carries out a data dependent approach in managing monetary policy, and the ongoing expansion in employment may push the Fed to further combat inflation amid the lack of progress in achieving the 2% target.
US Economic Calendar

In turn, Fed officials may show a greater willingness to keep US interest rates higher for longer as Chairman Jerome Powell and Co. are slated to update the Summary of Economic Projections (SEP), and the fresh forecasts may drag on the price of gold should the central bank offer a hawkish forward guidance for monetary policy.
However, the FOMC may prepare US households and businesses for a less restrictive policy in an effort to avoid a recession, and the update to the Fed’s SEP may curb the recent weakness in the price of gold should Fed officials continue to project lower interest rates in 2024.
With that said, the price of gold may trade within a defined range if it continues to hold above the May low ($2277), but bullion may no longer exhibit the bullish trend from earlier this year as it struggles to track the positive slope in the 50-Day SMA ($2342).
Gold Price Chart – Daily

Chart Prepared by David Song, Strategist; XAU/USD on TradingView
- The price of gold gives back the advance from earlier this week to approach the May low ($2277), and bullion may no longer track the positive slope the 50-Day SMA ($2342) as it struggles to hold above the moving average.
- A break/close below the $2277 (100% Fibonacci extension) to $2286 (100% Fibonacci extension) region raises the scope for a move towards $2242 (61.8% Fibonacci extension), with the next area of interest coming in around the April low ($2229).
- Nevertheless, the price of gold may face range bound conditions if it defends the May low ($2277), with a move above $2396 (78.6% Fibonacci extension) to bringing last month’s high ($2450) on the radar.
Additional Market Outlooks
US Dollar Forecast: USD/JPY Rebounds from 50-Day SMA Ahead of US NFP
US Dollar Forecast: Post-BoC USD/CAD Rally Eyes May High Ahead of NFP
--- Written by David Song, Strategist
Follow on Twitter at @DavidJSong


