Gold Price Outlook: XAU/USD
The price of gold manages to hold above the 50-Day SMA ($1948) after falling for four consecutive days, but the precious metal may track the negative slope in the moving average as the Federal Reserve is expected to deliver a 25bp rate-hike.
Gold Price Holds Above 50-Day SMA Ahead of Fed Rate Decision
The price of gold bounces back from a fresh weekly low ($1952) even as the International Monetary Fund (IMF) insists that ‘central banks should remain focused on restoring price stability,’ and it remains to be seen if the update to the World Economic Outlook will sway the Federal Open Market Committee (FOMC) amid the improved outlook for the United States.
Join David Song for the Weekly Fundamental Market Outlook webinar. David provides a market overview and takes questions in real-time. Register Here
IMF World Economic Outlook July 2023

According to the IMF, the US is now expected to expand 1.8% in 2023 compared to the 1.6% rate of growth projected in April, and little signs of a looming recession may allow FOMC to pursue a more restrictive policy as ‘inflation is projected to remain above target in 2023 in 96 percent of economies with inflation targets and in 89 percent of those economies in 2024.’
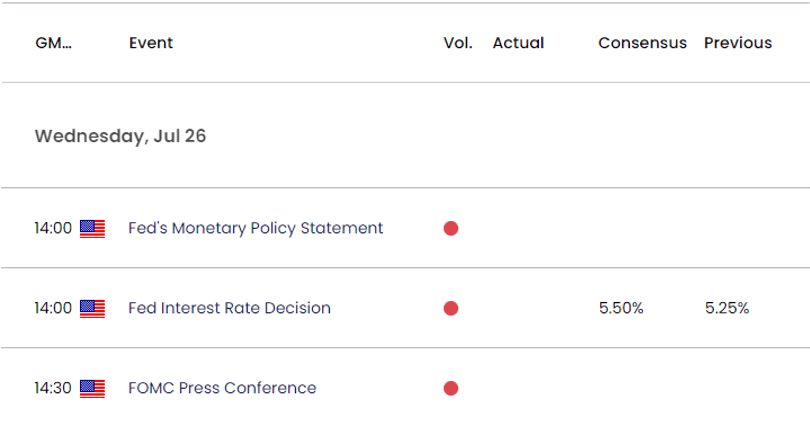
US Economic Calendar

As a result, the FOMC may vote for a 25bp rate-hike and keep the door open to implement higher interest rates as ‘economic scenarios with higher inflation appeared more likely than scenarios with lower inflation.’
In turn, a hawkish rate-hike on the price of gold as Governor Christopher Waller points out that ‘the Summary of Economic Projections (SEP) signaled two additional rate hikes by the end of this year,’ but a shift in the Fed’s forward guidance may heighten the appeal of bullion as it fuels speculation for a change in regime.
With that said, a dovish Fed rate-hike may generate a larger rebound in the price of gold as the FOMC seems to be nearing the end of its hiking-cycle, but the precious metal may track the negative slope in the 50-Day SMA ($1948) if it fails to hold above the moving average.
Gold Price Chart – XAU/USD Daily

Chart Prepared by David Song, Strategist; Gold Price on TradingView
- The price of gold carves a series of lower highs and lows after struggling to hold above the $1973 (78.6% Fibonacci retracement) to $1977 (50% Fibonacci extension) region, and the precious metal may track the negative slope in the 50-Day SMA ($1948) if it fails to hold above the moving average.
- A break/close below the $1928 (23.6% Fibonacci retracement) to $1937 (38.2% Fibonacci extension) area may lead to a test of the monthly low ($1903), with the next region of interest coming in around $1886 (23.6% Fibonacci extension) to $1897 (61.8% Fibonacci retracement), which incorporates the June low ($1893).
- Nevertheless, the price of gold may snap the bearish price series if it continues to hold above the moving average, with a move back above the $1973 (78.6% Fibonacci retracement) to $1977 (50% Fibonacci extension) region raising the scope for a test of the monthly high ($1988).
Additional Resources:
AUD/USD Faces Australia Inflation Data Ahead of Fed Rate Decision
USD/JPY Rally Emerges - Outlook Hinges on Fed and BoJ Rate Decisions
--- Written by David Song, Strategist
Follow on Twitter at @DavidJSong


