
Gold, XAU/USD Talking Points:
- Gold prices have continued their pattern of strength in a move that’s now nearing three weeks.
- XAU/USD had found support at a bullish trendline on June 26th and bulls have been driving ever since, setting a fresh all-time-high yesterday while making a run towards the $2,500 psychological level.
- I’ll be discussing these themes in-depth in the weekly webinar. It’s free for all to register: Click here to register.
Gold prices have continued to break out and yesterday marked a fresh all-time-high for the yellow metal. It’s been a brisk move over the past three weeks, from when gold was previously testing a key spot of support while threatening a deeper breakdown.
Since then, however, bulls have come back in a very big way. The second quarter was marked by range-bound price action and mean reversion, but there was a large pull from major psychological levels.
Early in the quarter, the gold breakout rushed up to a fresh ATH; but bulls were unable to hold the move above the $2,400 level. The pullback from that tested below $2,300, but that move didn’t last for long either, as bulls simply came back to offer support and push price back above the big figure.
The next test above $2,400 similarly failed to gain traction and, again, price dipped down for a re-test of $2,300, and that’s when the trendline began to come into play while helping to hold lows.
At this point, it seems that buyers have finally gained acceptance above the $2,400 level and they’ve already made a fast run towards the next big figure, the major psychological level of $2,500.
Gold (XAU/USD) Daily Price Chart
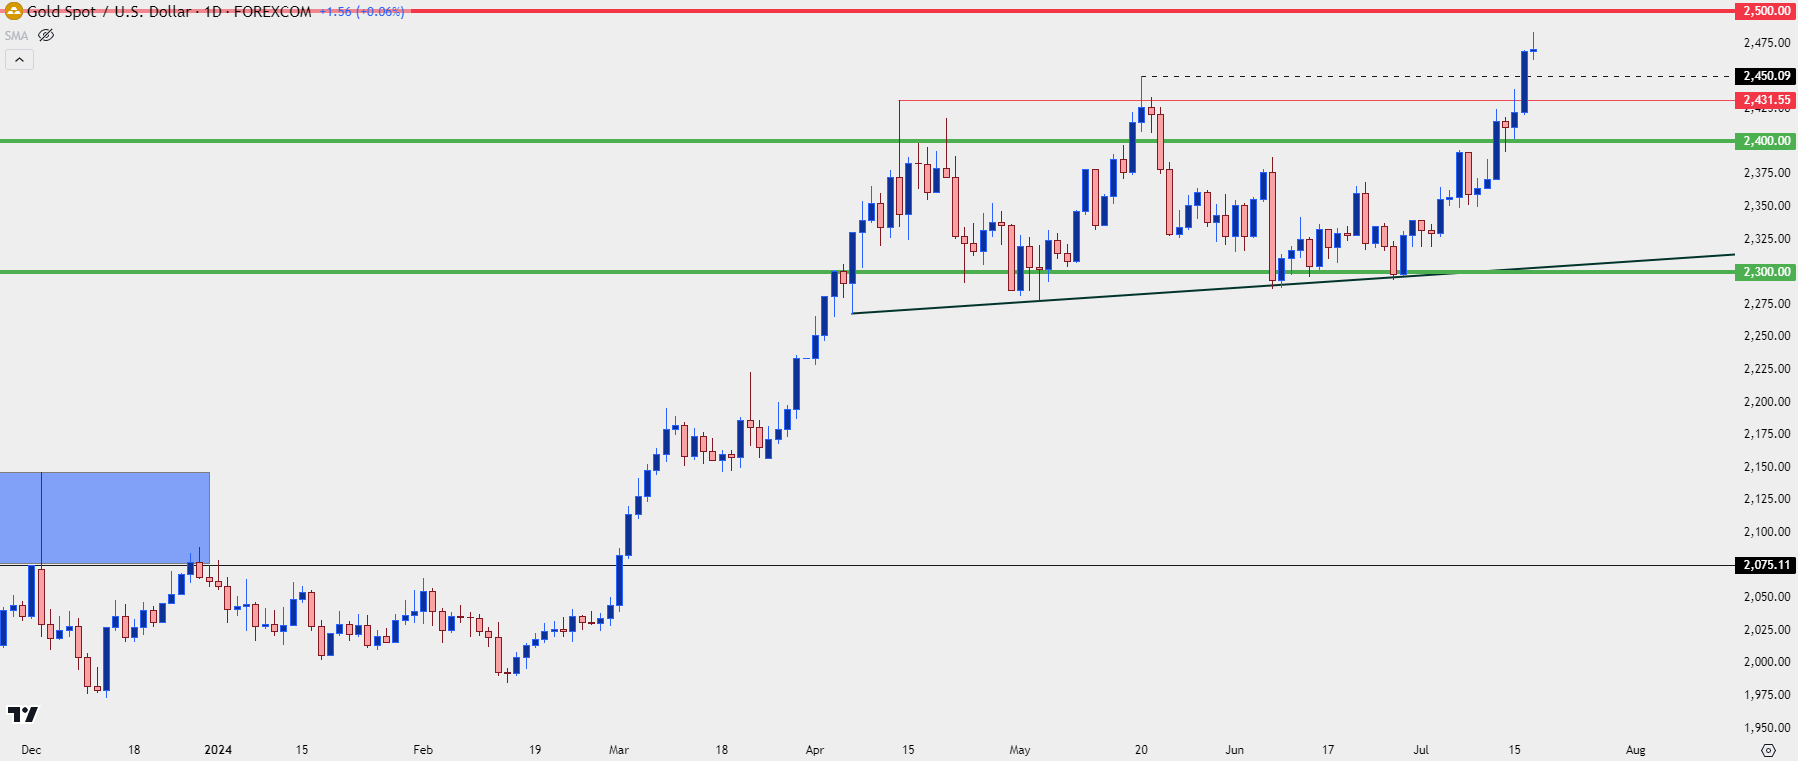 Chart prepared by James Stanley, Gold on Tradingview
Gold: Overbought Across Multiple Time Frames
Naturally the big question after a move of this nature is continuation potential. And it would be difficult to muster a case against a trend that’s priced-in this cleanly and, to be sure, there’s no evidence yet that it’s over.
Perhaps making matters more interesting is the timing of the move, as the bullish trend in gold accompanies a bearish move in the US Dollar, both of which started around the Presidential Debate on the evening of June 27th. I’m normally one to dismiss the impact of short-term political stimuli on markets and perhaps this is coincidence, but the debate was shocking for many and brings several questions around current US government. As Nate Silver has dubbed it, that seemed to be an ‘emperor has no clothes’ moment.
Now, to be completely fair, that hasn’t been the only bearish item for the USD as Fed-speak has generally sounded fairly dovish, and the most recent CPI data point has helped to build the expectation for a third rate cut this year. But even that brings question, as markets are currently expecting no move in July and three cuts by the end of the year which, deductively, would highlight three consecutive 25 bp cuts in the final three FOMC meetings of 2024, surrounding a Presidential election.
For a central bank that’s been cautious in the past of impacting election results, that sounds like a bank that’s moving into emergency-like policy, which is confounding when considering that the S&P 500 set a fresh all-time-high just yesterday.
So, the debate, combined with the dovish stance of the Fed despite the bank saying that the economy is on solid footing creates uncertainty and that’s something that markets generally abhor. That uncertainty can, however, benefit gold prices as gold is something that can’t be as easily diluted with more government spending.
Of note here, however, is longer-term context. And as of this writing, spot gold prices are showing overbought reads on the monthly and weekly charts with the daily not far behind.
The daily chart showing RSI pushing into overbought territory is not a direct bearish driver, as you can see from the below chart the prior two examples in March. Gold prices shot-higher after RSI crossed above the 70-level; so an overbought RSI reading has not been a hindrance to the gold advance seen so far in 2024 trade.
Gold Daily Price Chart
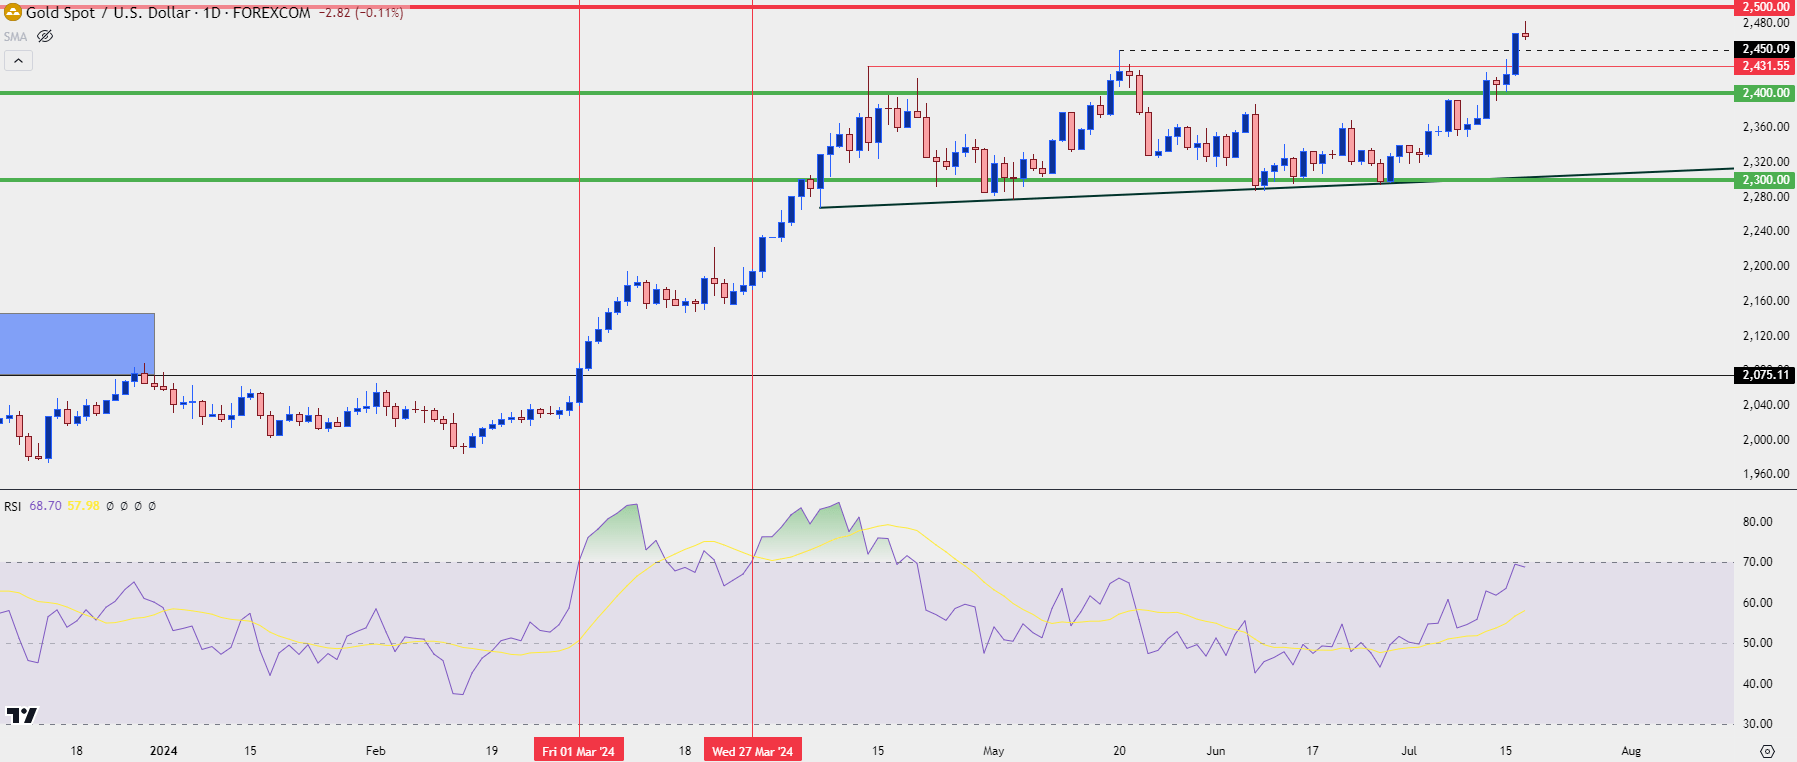 Chart prepared by James Stanley, Gold on Tradingview
Gold: $2,500 is Big
I talked about this at-length in yesterday’s webinar and I touched on it a little earlier in this article, but psychological levels can play a massive impact in market dynamics, such as we saw with gold in Q2.
But we can span that story back for years to illustrate a similar drive.
In the summer of 2020, the Fed was aggressively stimulating markets to help through wide-scale shutdowns. Stocks were flying higher and US Treasury rates were extremely low. The USD was smashed as the Fed and Treasury printed more and more money in effort of softening the blow of Covid-related shutdowns.
Gold initially put in a strong bullish move and for the first time in its history, it tested above the $2k level against the USD. That $2,000 level didn’t directly stop bulls either, as buyers posed a breakout in August of 2020 to test above that price. But – they didn’t get very far. The high ultimately printed at $2,075, and then prices reverted back-below $1,700 over the next seven months.
For those with heavy fundamental drives, that move doesn’t make a lot of sense as this is when risk assets were shooting higher in most other major markets. But, in gold, bulls were uninterested, and prices simply continued to pullback until March of 2021.
The next run at $2k similarly failed and that instance showed with a backdrop of geopolitical risk, right around when Russia was invading Ukraine. This was also around the time of the Fed’s first rate hike of this cycle, and that move in gold stopped short of the $2,075 level with $2k, once again, serving as resistance.
The third run on $2k similarly failed and this was in Q4 of last year, when the Fed had started to sound really very dovish. And that price wasn’t entirely taken-out until March of this year. And before that happened, there was even the display of shorter-term support at that same price in January and February of this year.
But, the takeaway here is that the monetary backdrop had a few different looks in that three-plus years of range; so expecting a direct impact from fundamental analysis can often present a trap door. It was the $2k level that had held bulls at bay until, eventually, persistence from buyers allowed for a strong and clean breakout. And the fact that this happened right around a major psychological level of $2,000/oz highlights the incredibly important role that rounded, whole numbers can have on market dynamics.
Gold Monthly Price Chart
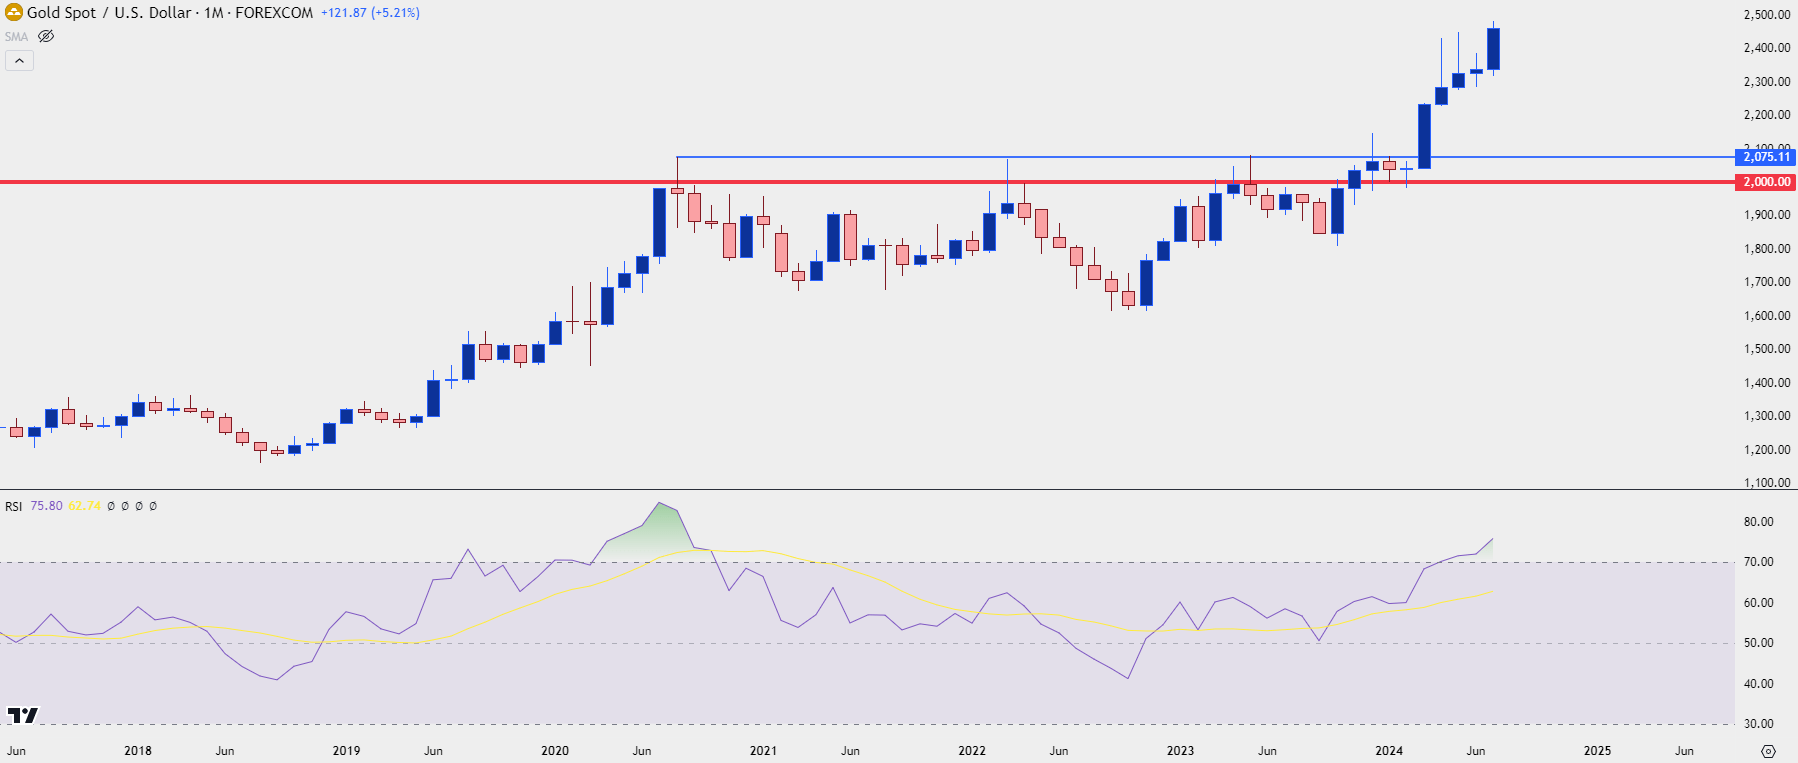 Chart prepared by James Stanley, Gold on Tradingview
Gold: $2,500 Dynamics
Alluding to my earlier comment on shorter-term price action, and we’ve seen a similar story of psychological levels playing a role of late.
The breakout that hit in March had a full head of steam and ran into the first couple weeks of Q2 trade. Resistance eventually showed at a high of $2,431, with buyers unable to gain acceptance above the $2,400 level. The pullback from that went down to $2,300, at which point sellers failed to gain acceptance below that big figure.
Think of it like going shopping at the store. You know that steak is pretty expensive, let’s say you’re lucky and normally paying $11/lb for New York Strip. If you suddenly see that price at $9.99, it’ll probably grasp your attention, right? In reality it’s only about 9% cheaper but it can seem much more so because of that important break point below $10.
This is why most retailers on Planet Earth use prices that end in increments of 0.99 or 0.97 – the impact on human psychology and how it can get you to buy more of a product.
Given inflation, this can also work on the way up, as NY Strip at $15/lb would seem prohibitively expensive; so, you probably wouldn’t buy it. That would lead to a glut of supply and then that supermarket would probably be looking to mark down prices until demand eventually returned.
That’s similar to what happened to gold last quarter at $2,400. Once prices traded above that figure following a massive move in March and early-April, bulls had ‘sticker shock,’ and this led to lessened demand which was followed by falling prices.
Once price tested below $2,300, there was a perceived value, like NY Strip at $9.99, and as that demand returned from buyers, prices tilted-higher again. Last quarter was like a ping pong match between the psychological values of $2,300 and $2,400 but perhaps the more important takeaway, as I had looked into ahead of quarter-end, was the fact that there was a very clear backdrop open for a deeper pullback – but bulls would not give up defense of the $2,300 level.
Gold Weekly Price Chart
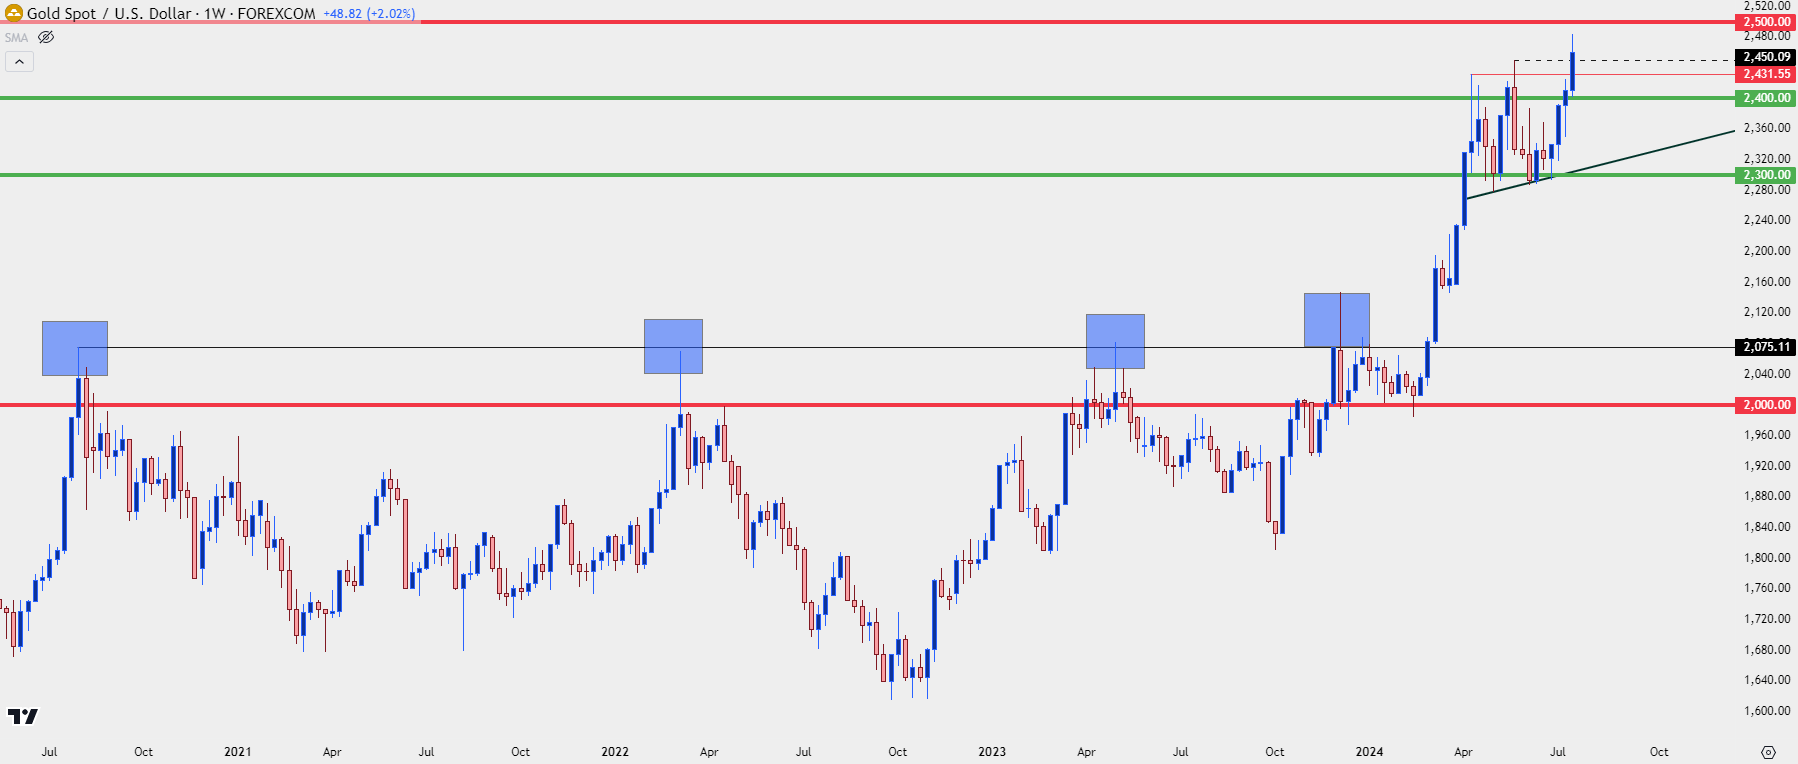 Chart prepared by James Stanley, Gold on Tradingview
Gold: Can $2,500 Change the Trend?
If you’d have went back to August of 2020 and told traders that gold would top at $2,075 despite the Fed’s monetary cannons being fully engaged, there probably wouldn’t be very many that would believe you.
Firstly, it’s difficult for most people to imagine something different happening from what’s been happening. But, more logically, the fundamental backdrop that’s generally supportive for gold failed to push prices higher, and gold then spent the next three-plus years in a range despite massive trends building elsewhere (stocks, bitcoin, etc.).
In my opinion, $2,500 could become a big deal and I think it’s already started to show impact on shorter-term dynamics. A major psychological level of that nature could be seen as a significant price level, like $15 or $20 for NY Strip steak; the type of level that grabs your attention. It would be difficult to suggest that $2,500 is as important as $2,000, because the latter is more-rounded than the former, but as human beings we often can’t help but feel the impact of these whole numbers.
At this point, buyers have come within $20 of re-testing that value and that’s around when buying demand started to slow. If you think of it from a shifting risk-reward perspective, that can make sense, as traders looking to take profit at the big figure have theoretically capped upside potential. This is one of the reasons that major psychological levels can show impact without actually having to come into play, as the simple thought of turbulence at that price can be enough to dissuade bulls from chasing the move-higher.
But that also does not suggest that a reversal is imminent and at this point, bulls remain firmly in control of near-term trends. Given the prior bullish structure, there’s now support potential at $2,450 which was the prior ATH set in May; $2,431, which was the previous ATH set in April, and then, of course, the $2,400 psychological level which offered multiple instances of resistance in Q2.
If price dips down to test that big figure for support, which was prior resistance, and if buyers perceive a value after the pullback, that can help to set the low as flows shift to bullish again.
Gold Four-Hour Price Chart
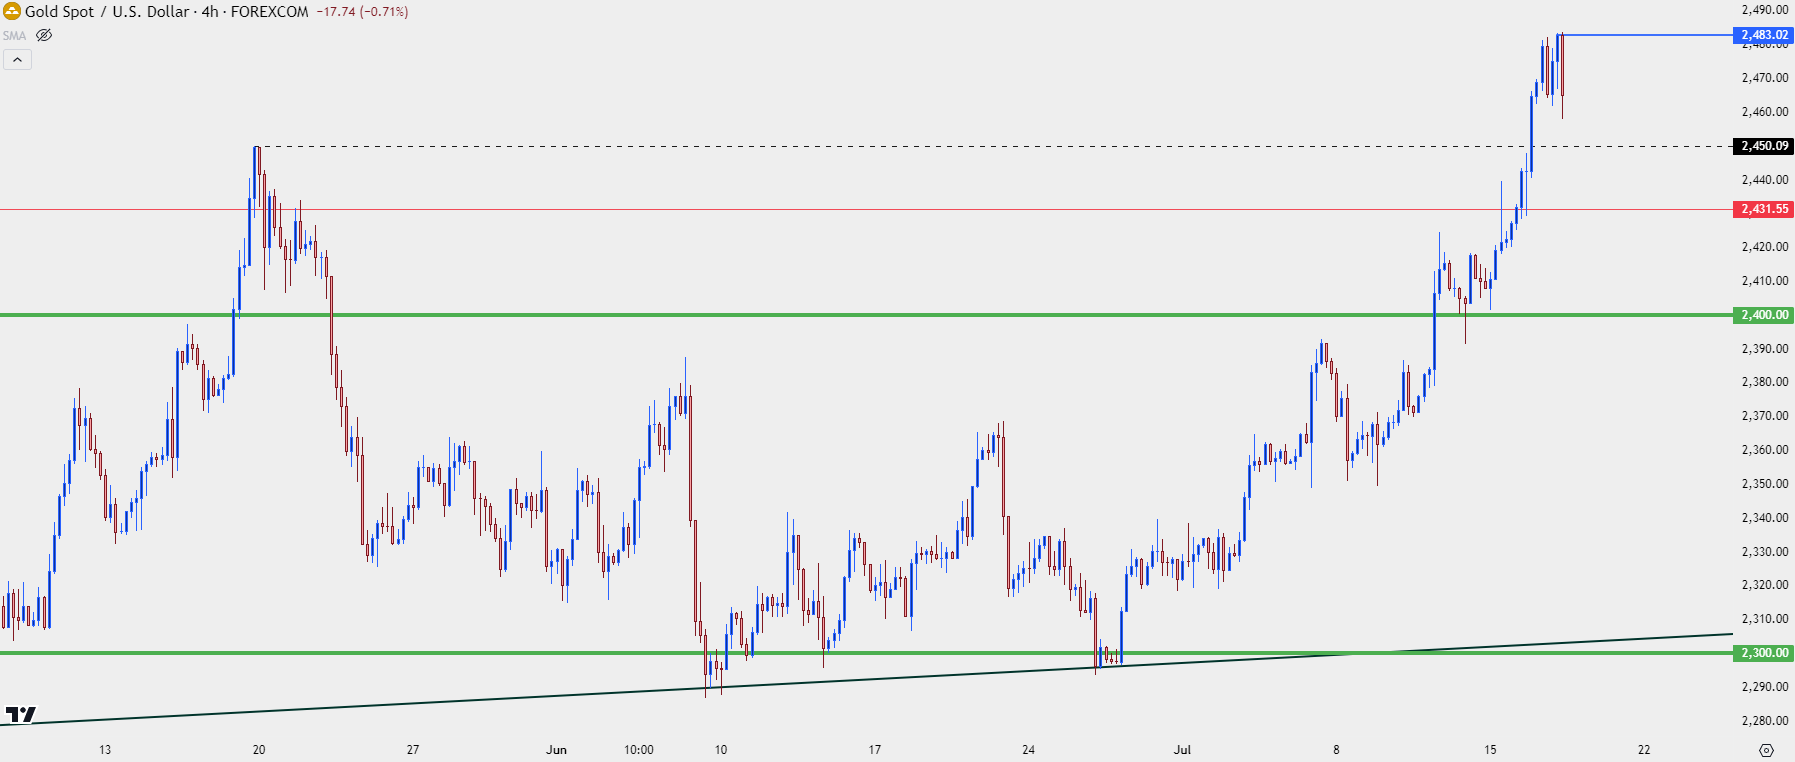 Chart prepared by James Stanley, Gold on Tradingview
--- written by James Stanley, Senior Strategist


