Gold Talking Points:
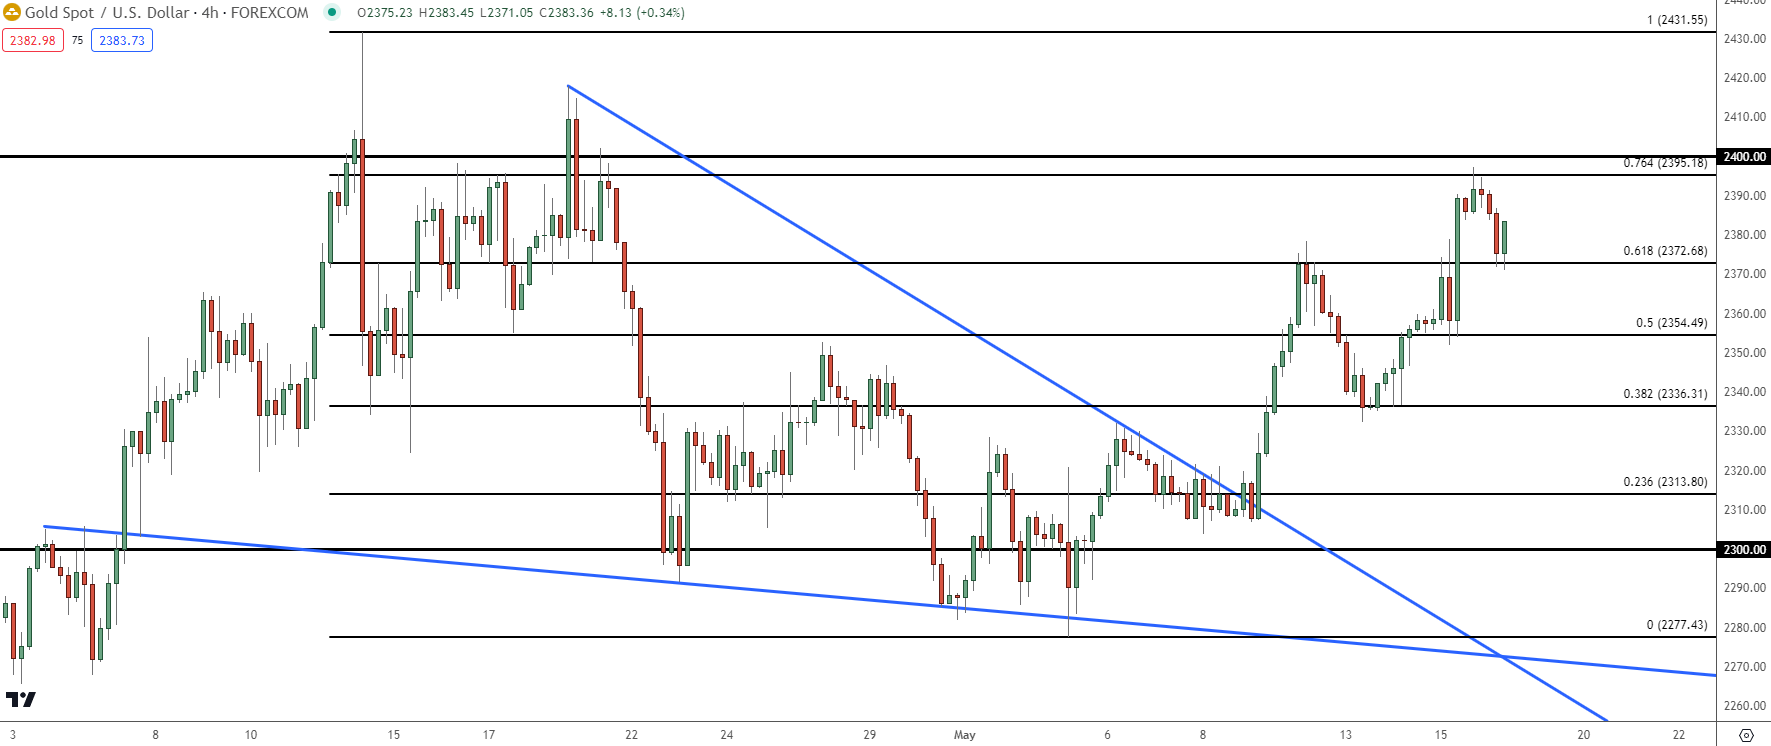
- Gold started the week with continuation of a pullback, but support showed at the Fibonacci level of 2336 and bullish continuation took over.
- After two days of considerable strength, Gold bulls showed trepidation just below the $2400 level, which has led to another pullback. But this time support is showing at the 2372 Fibonacci level which is the 61.8% retracement of the same major move (and the spot that helped to hold the highs last week).
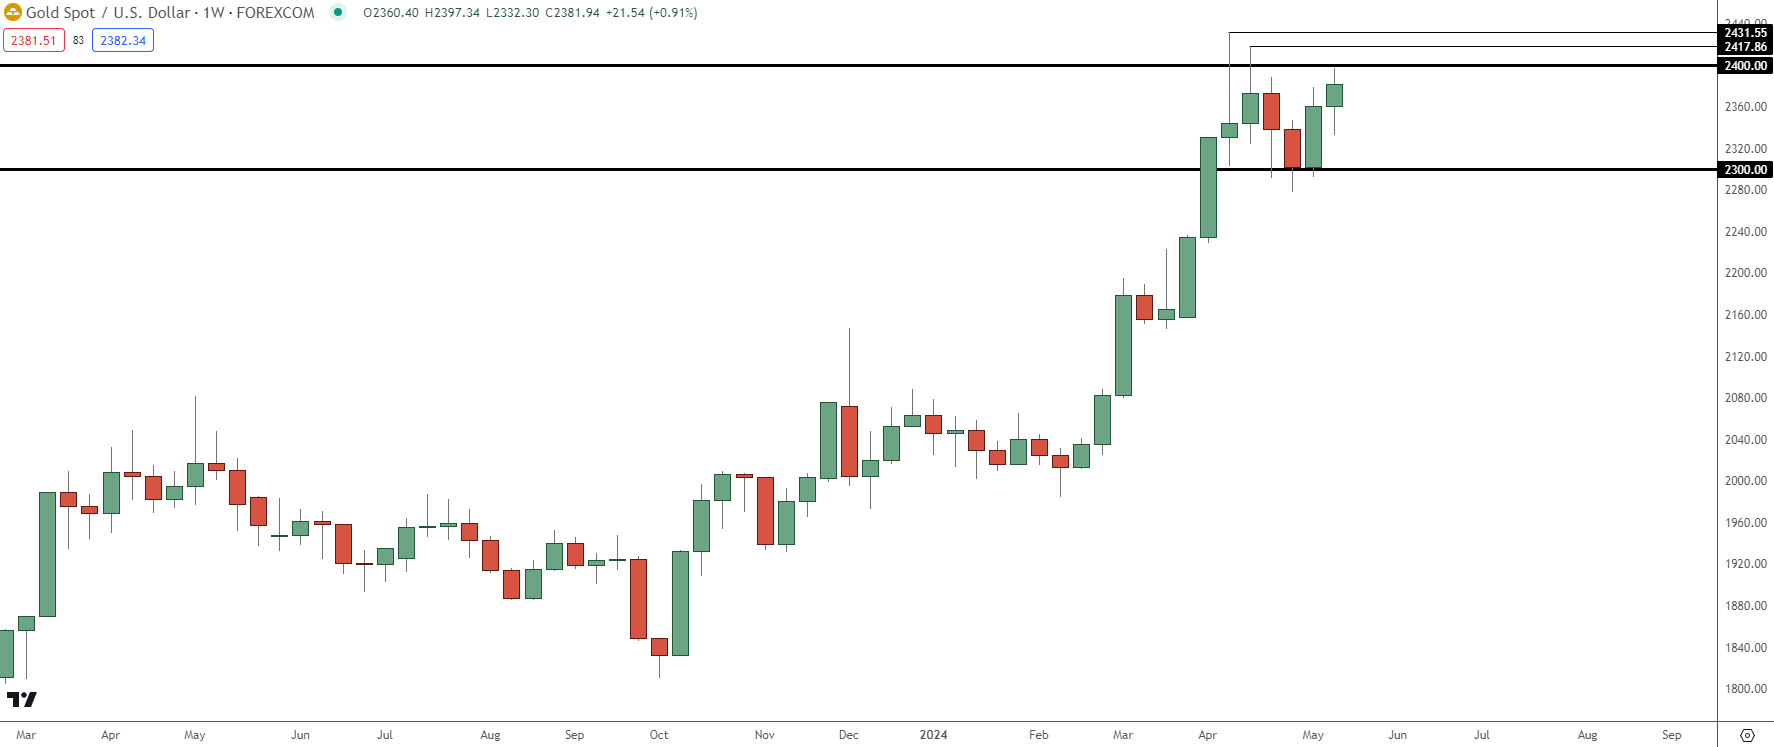
- Can Gold bulls finally muster the decisive breakout past the $2400 level? There hasn’t yet been a weekly close above that price in spot XAU/USD but bulls retain control as we near the end of the week.
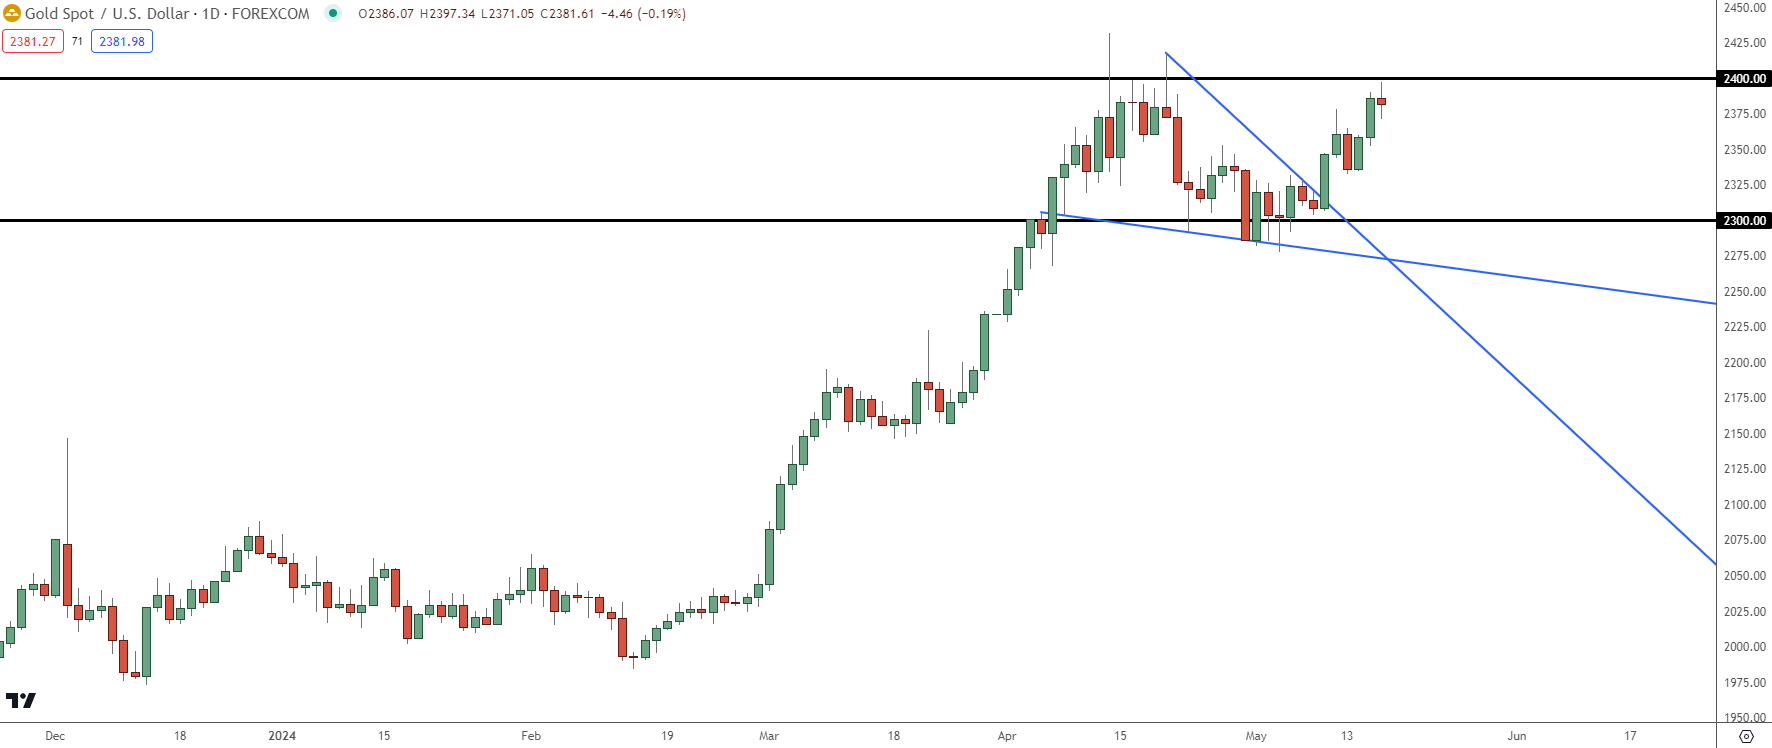
Gold prices broke out of a falling wedge pattern in a very big way last week.
Coming into April Gold prices were flying higher, eventually pushing weekly RSI into deeply overbought territory. I had looked at this at the time, and that was when Gold was struggling to hold a bid above the psychological level of $2400.
The pullback from those highs showed up around the next weekly open and there were a couple of days where bears made decisive pushes. But, just like Gold bulls failed to gain acceptance above the $2400 level, Gold bears struggled to gain acceptance below $2300. There was a single daily close below that price but in the days after, buyers returned to hold support above the level while also building in a backdrop of higher-lows.
That’s what allowed for the build of the falling wedge – as sellers were showing more aggression at highs or near resistance but suddenly showed passiveness near lows or at support.
Gold Daily Price Chart
 Chart prepared by James Stanley, Gold on Tradingview
Gold This Week
I had written the weekly forecast for Gold that was published on Saturday, highlighting the bullish break of the falling wedge formation; but there was another technical item that could be taken from the pullback and that’s a Fibonacci retracement that has continued to show inflections.
Taking the April high down to the May low produces a 61.8% Fibonacci retracement at $2372.68. That’s what helped to hold the highs on Friday before a pullback appeared.
That pullback ran all the way down to the 38.2% retracement of the same study. That plots at $2336.31, and that price helped to hold the lows on Monday and into Tuesday, at which point bulls came back.
That then led to a run and a pause at the 61.8% level, followed by extension up to the 76.4% retracement at $2395.18, and that’s so far held the highs for this week.
And the pullback from that has so far held support on a re-test of support at prior resistance, at the same 61.8% retracement of 2372.68.
Gold Four-Hour Price Chart
 Chart prepared by James Stanley, Gold on Tradingview
Gold Strategy Moving Forward
The breakout running through the April open moved into deep overbought, and even the pullback from that move retained a degree of bullishness as shown by the falling wedge formation, indicating that the bearish move was more of a correction in a bullish theme than the start of a bearish one.
At this point the big question is whether bulls have the drive to push a weekly close above the $2400 level which is something that hasn’t taken place yet in spot XAU/USD. The two instances that we did have of price testing over that level were met with fast pullbacks, with the second test also showing a lower-high.
This provides some context should continuation show, and gold bulls holding the bid above the big figure would illustrate a strong response to the pullback that started a month ago.
Above the 2400 level, there are prior swings at 2417 and 2431, after which the major psychological level of 2500 would be the next major price overhead.
Given that price would be at fresh all-time-highs beyond 2431, a degree of projection would be required to set shorter-term resistance levels, and this could put focus on spots such as 2450 or 2475 before a test of 2500 could come into the picture.
Gold Weekly Price Chart
 Chart prepared by James Stanley, Gold on Tradingview
--- written by James Stanley, Senior Strategist


