Gold Talking Points:
- Gold put in a massive bullish move in March as the Fed highlighted their expectation for two to three cuts in 2024. While bulls continued to show support in Q2 they were continually thwarted at the $2,400 level, leading to a range-bound showing for Q2.
- Gold spent three-plus years with resistance at $2,075 and to date, that level has not yet been re-tested for support since the breakout. If bulls begin to let support slip, that becomes a focal point for pullback potential.
- I’ll be discussing these themes in-depth in the weekly webinar. It’s free for all to register: Click here to register.
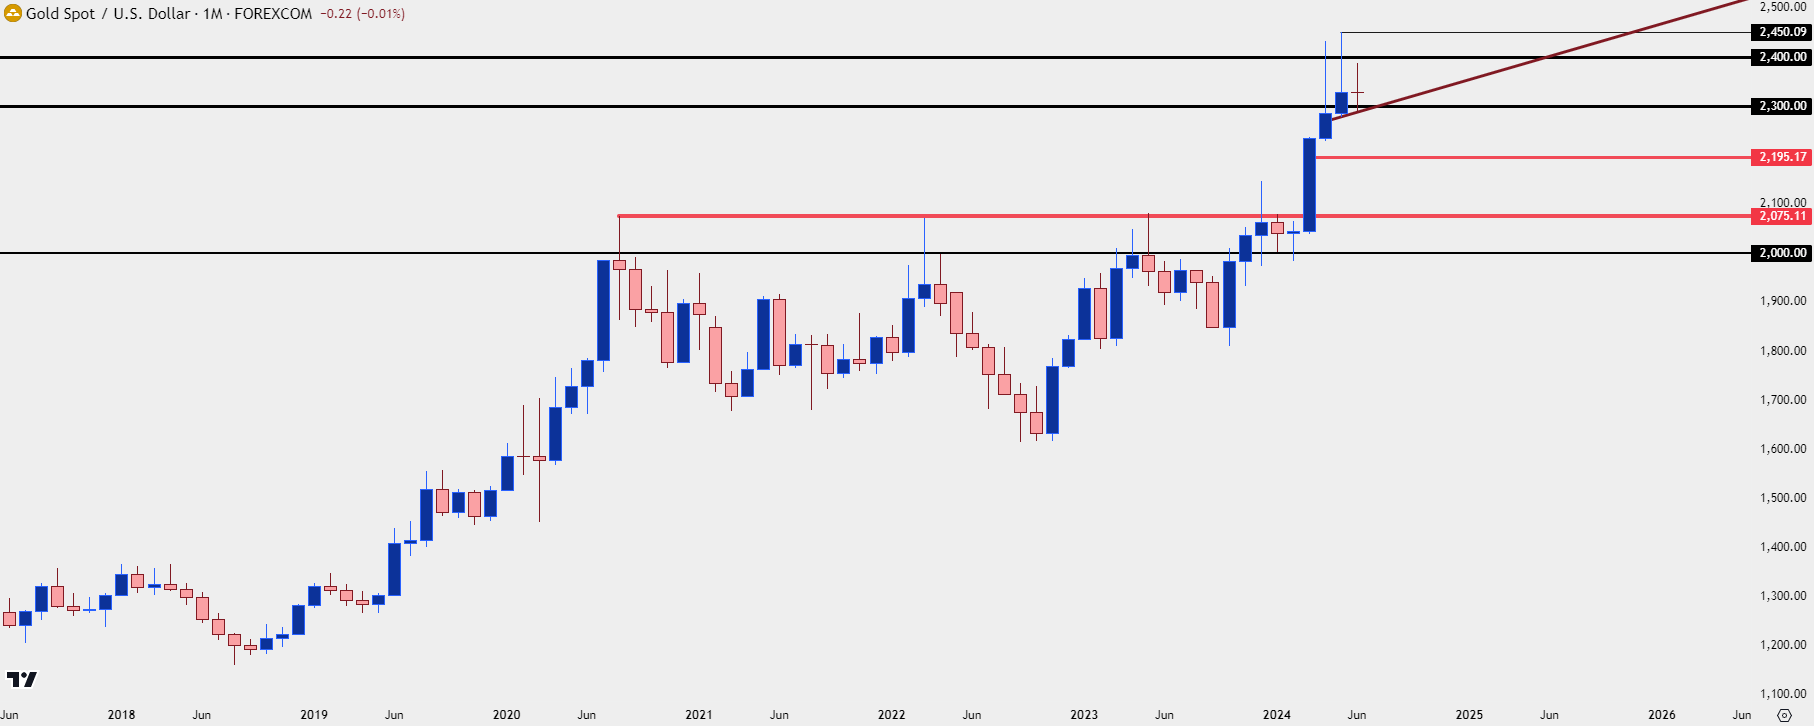
The bullish cycle in Gold has held on for nine full months, drawing back to the Q4 open last year. At the time, Gold was very oversold and the statement can even be made that it was historically oversold at the time. As the Fed warned of the possibility of more rate hikes to temper inflation, Gold bears had their way and prices looked to be headed below the $1,800 handle.
But that’s around the time that tensions began to tighten in the Middle East, and that soon led to a bounce that hastened in November as the Fed started to sound more-dovish.
In December, bulls finally went for the breakout: The same $2,075 level that had held resistance for the past three years was finally traded through, albeit temporarily, as that breakout failed and prices pulled back. But – the pullback from that false breakout held support at the $2,000 psychological level, keeping bulls in-place to continue the broader trend.
The breakout arrived in March, helped along by a still-dovish Fed that was projection two to three rate cuts in 2024 trade. That month Gold put in a massive breakout and that continued through the Q2 open.
Resistance finally appeared at the $2,400 psychological level, which bulls were unable to leave behind. And they took another shot in May, setting a fresh all-time-high at $2,450 but, again, they were unable to hold the move. And June has so far been a doji as indecision has crept into the market but the takeaway at this point is the continued support from bulls around the $2,300 psychological level.
Gold Monthly Price Chart
 Chart prepared by James Stanley, Gold on Tradingview
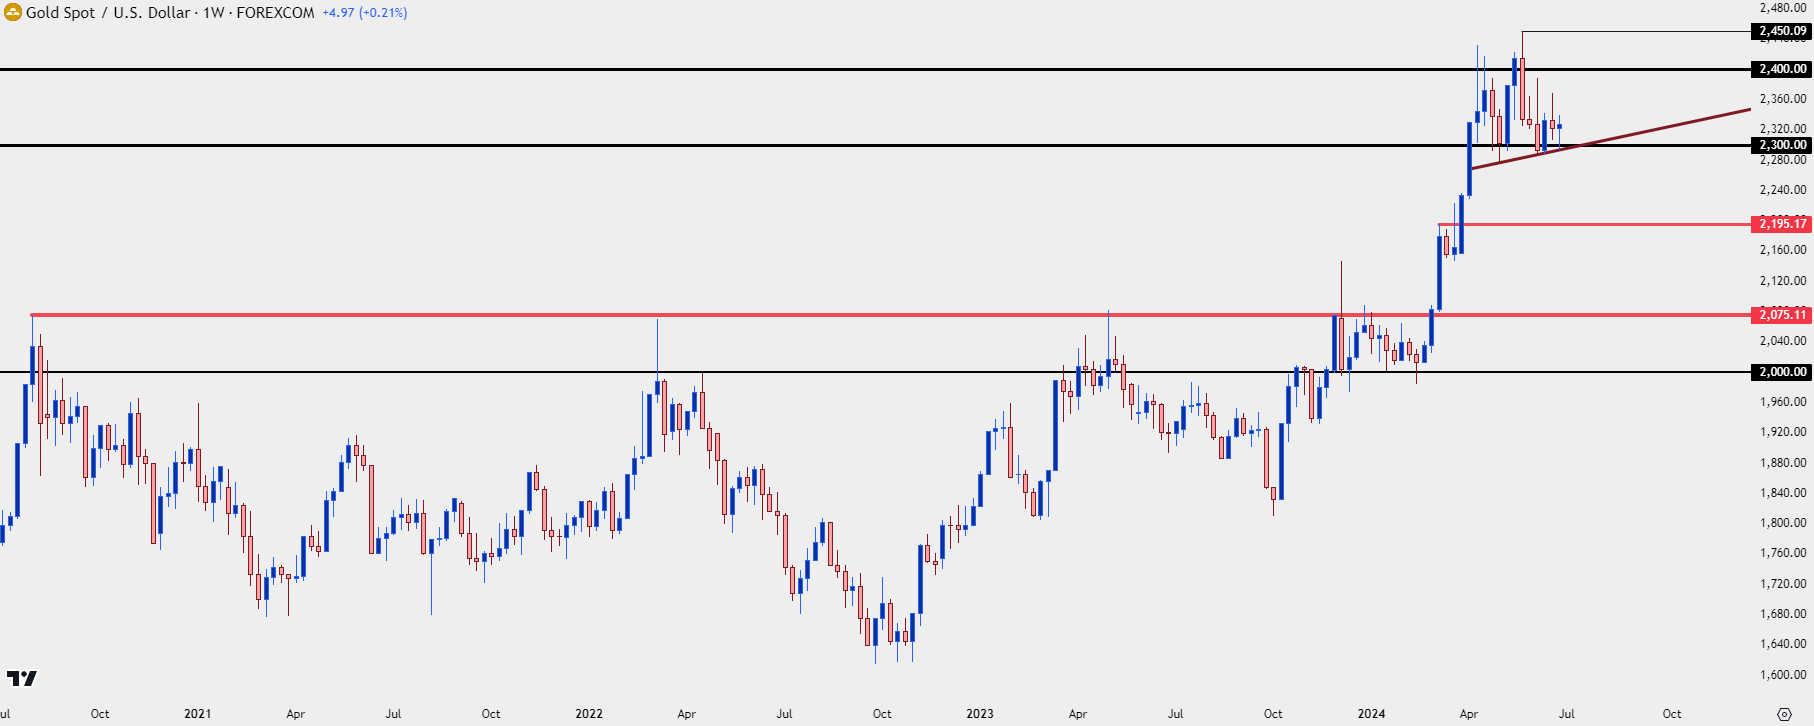
On a shorter-term basis the recent mean-reverting backdrop of Gold becomes clearer. There were multiple tests above the $2,400 level in the quarter and there was even a weekly close above that level. But the high that printed a week later at $2,450 brought a reversal into the mix and price retreated to $2,300 support.
June was populated by both lower-highs and lower-lows, indicating compression, and as we’d seen above on the monthly chart the net result of that gyrating price action was a doji.
On net – this could be setting the stage for a pullback scenario and given the lack of support tests at prior range resistance of $2,075, there’s a clear place to look for that pullback to run towards. Between current price and that support is another spot of reference at $2,195.
Gold Weekly Price Chart
 Chart prepared by James Stanley, Gold on Tradingview
Gold Shorter-Term
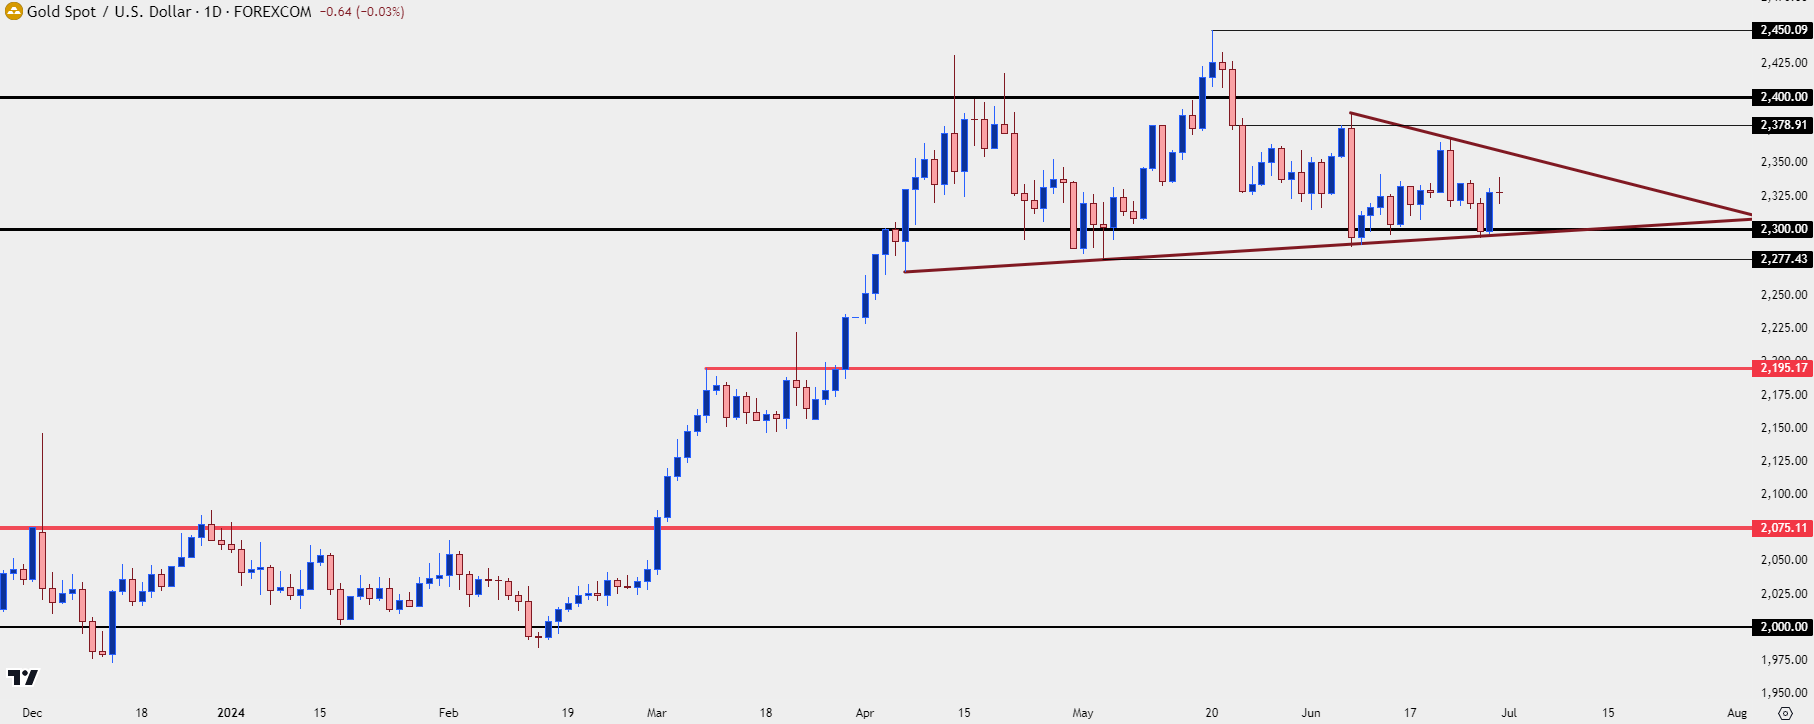
Gold bears took a few different shots in Q2 but they were continually thwarted around the $2,300 psychological level. There’s a bullish trendline connecting the lows of April, May and June, and that remains in-effect as we move into the third quarter and the second-half of 2024 trade.
For a pullback to fill in, bears taking out that support would be a necessary first step. Given the recent hawkish twist at the Fed, that seems a possible scenario if US data prints with strength, bringing with it the idea that rate hikes are even further out on the horizon.
If bulls can hold the line, the next logical place of resistance above the $2,450 Q2 high would be the psychological level at $2,500. For now, buyers retain control and support remains in-place.
Gold Daily Price Chart
 Chart prepared by James Stanley, Gold on Tradingview
--- written by James Stanley, Senior Strategist


