Gold Price Outlook: XAU/USD
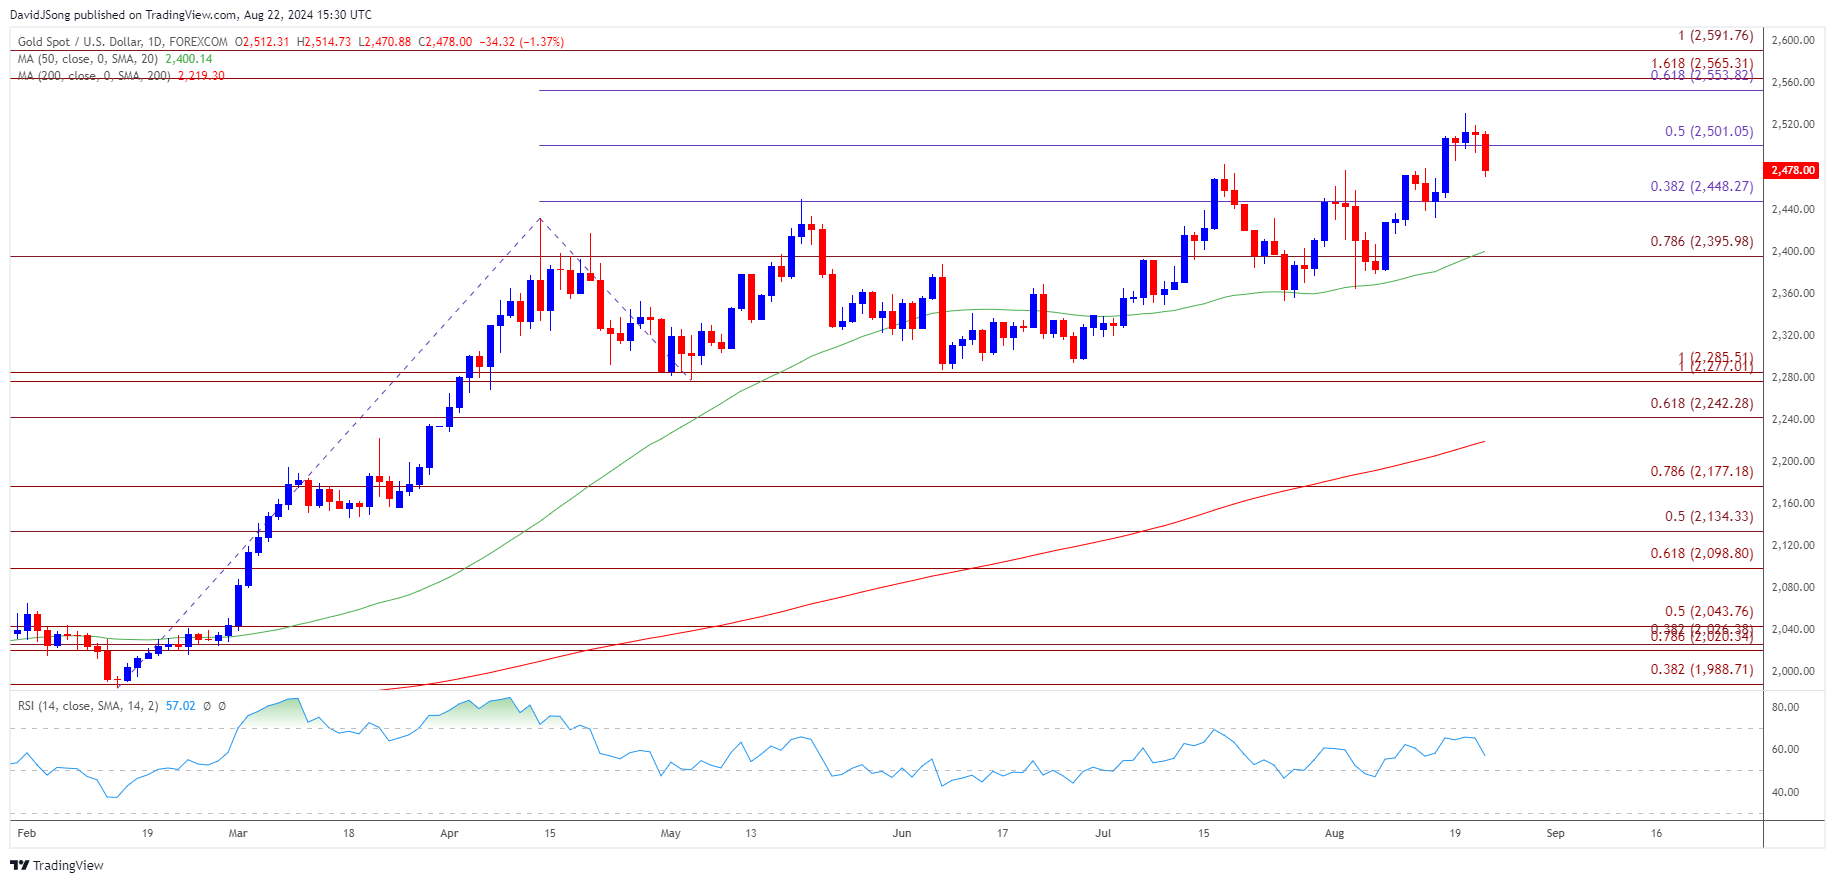
The price of gold continues to pullback from a fresh record high ($2532) to keep the Relative Strength Index (RSI) below 70, but the price of gold may reestablish the bullish trend from earlier this year as the 50-Day SMA ($2400) develops a positive slope.
Gold Price Forecast: XAU/USD Pullback Keeps RSI Below 70
The price of gold trades to a fresh weekly low ($2471) following the limited reaction to the Federal Open Market Committee (FOMC) Minutes, and the RSI may show the bullish momentum abating as the oscillator seems to be reversing ahead of overbought territory.
Join David Song for the Weekly Fundamental Market Outlook webinar. David provides a market overview and takes questions in real-time. Register Here
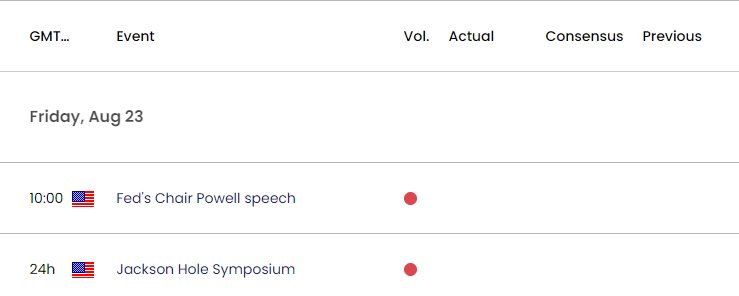
In turn, bullion may continue to give back the advance from the monthly low ($2364) as it initiates a series of lower highs and lows, and it remains to be seen if the Kansas City Fed Economic Symposium in Jackson Hole, Wyoming will sway the price of gold as Chairman Jerome Powell is scheduled to speak.
US Economic Calendar

It seems as though the Federal Open Market Committee (FOMC) is preparing to alter the course for monetary policy in an effort to avoid a recession, and speculation for an imminent change in regime may lead to a shift in trader sentiment as major central banks start to unwind their restrictive policies.
With that said, a pickup in risk-taking behavior may curb the appeal of gold, but the threat of a policy error by major central banks may keep bullion afloat amid expectations for a rate-cut at the next Fed interest rate decision on September 18.
XAU/USD Price Chart – Daily

Chart Prepared by David Song, Strategist; XAU/USD on TradingView
- The price of gold is on track to close below $2500 (50% Fibonacci extension) as it falls to a fresh weekly low ($2471), with a breach below $2450 (38.2% Fibonacci extension) raising the scope for a move towards $2400 (78.6% Fibonacci extension).
- Next area of interest comes in around the monthly low ($2364) but the price of gold may track the positive slope in the 50-Day SMA ($2400) should it continue to close above the moving average.
- A break above the monthly high ($2532) brings the around $2550 (61.8% Fibonacci extension) to $2570 (161.8% Fibonacci extension) region back on the radar, with the next area of interest coming in around $2590 (100% Fibonacci extension).
Additional Market Outlooks
Canada Retail Sales Report Preview (JUN 2024)
AUD/USD Rally Pushes RSI Towards Overbought Territory
US Dollar Forecast: USD/JPY Rebound Unravels Ahead of Fed Symposium
Canadian Dollar Forecast: USD/CAD Susceptible to Test of July Low
--- Written by David Song, Strategist
Follow on Twitter at @DavidJSong


