Gold Talking Points:
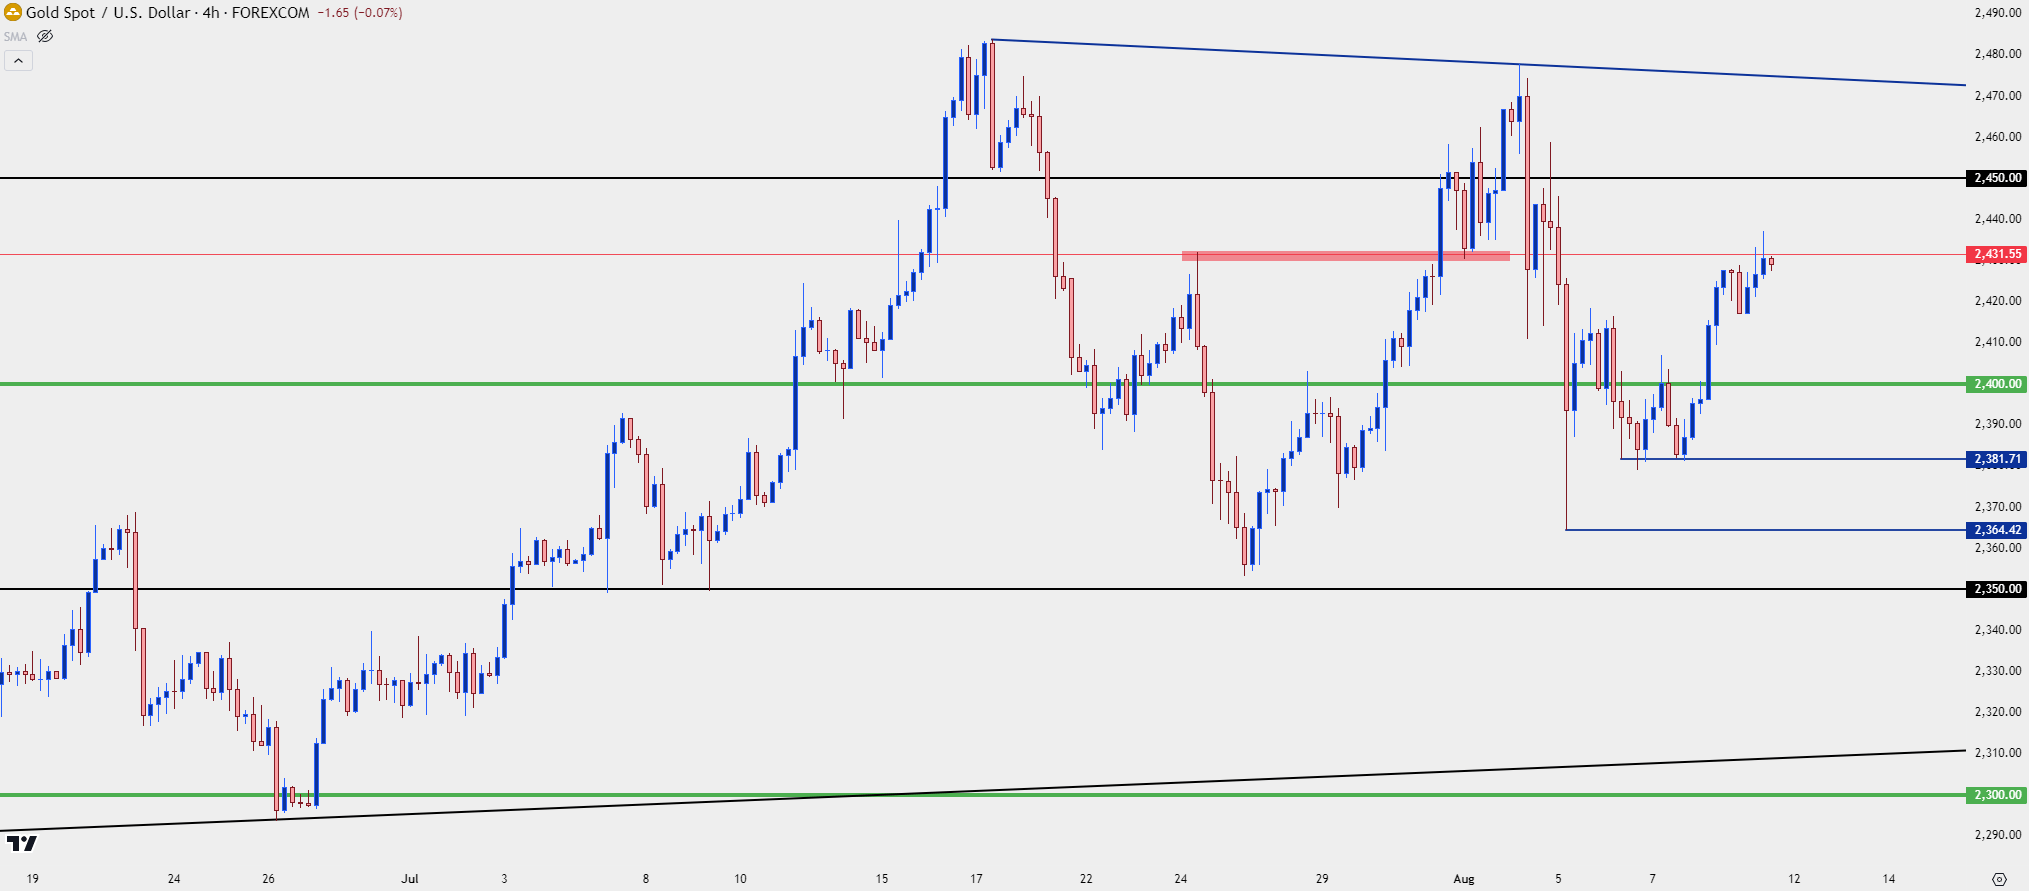
- It was a tale of two trends in gold last week. The metal sold off heavily after the Sunday open as panic gripped global markets. But a higher-low built on Tuesday and Wednesday that led to strength on Thursday and Friday.
- At this point gold continues to hold a longer-term bullish bias but the $2,500 level has remained elusive.
- The big risk as I see it for gold is like many other risk markets and that’s the prospect of lower yields, which can motivate capital out of risk markets and into Treasuries ahead of widely-expected rate cuts from the Fed.
- I’ll be looking into these setups in the Tuesday webinar and you’re welcome to join, click here for registration information.
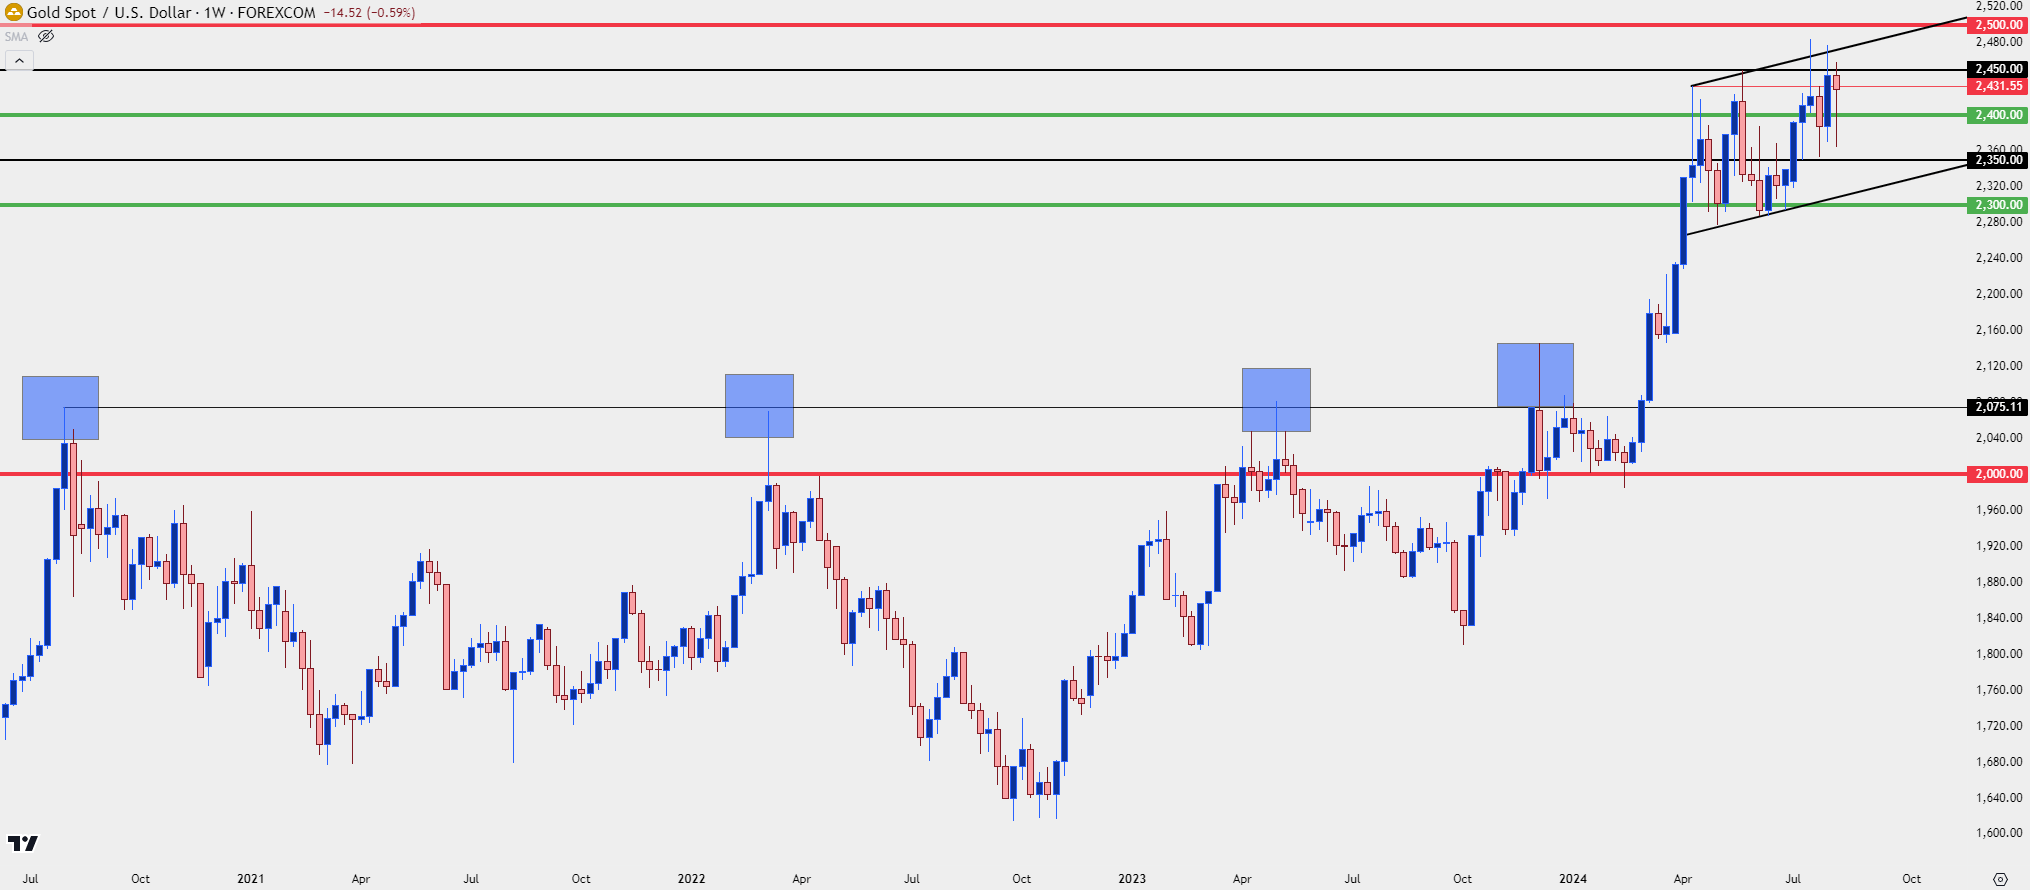
Gold continues to show consolidation on a longer-term basis; but the fact that there hasn’t yet been a deeper pullback is something that I’m construing as deductively bullish. With a breakout such as we saw in March and into April, normally, there will be some motive for profit-taking which can lead to a pullback. And in many cases, the target for that pullback will be around a prior level of resistance and in gold, given the three-plus years of resistance at $2k, that would seem to be a considerable possibility.
But – that hasn’t happened and as a matter of fact, buyers have put in visible defense of the $2,300 level over the past four months and there’s been an increasing acceptance around the $2,400 level, which initially showed as resistance back in April.
Gold Weekly Price Chart
 Chart prepared by James Stanley; data derived from Tradingview
Gold: Psychological Acceptance of Big Figures
I had recorded a video on the matter last week and I’ll link that below, as I discuss this very premise of ‘acceptance’ at these major price points.
Psychological levels are important because of human nature, as the price of $2,000.01 feels much more expensive than just two cents above $1,999.99. Above the big figure ‘feels’ more expensive and thus can inhibit buying behavior, leading to a build or hold of resistance. This explains the range that showed in gold from the summer of 2020 into this year. That technical grind took place even as the Fed initially held rates low and through the Fed’s hiking cycle; so those looking to fundamental explainers would have difficulty if ignoring the impact that the $2k level had on the yellow metal.
But – once gold was able to break out above the big figure, after it had ‘gained acceptance,’ bulls were ready to fly and price quickly moved all the way up to the $2,300 level and, eventually, the $2,400 level in April. That’s the point where matters began to slow and grind started to take-over, albeit to a lesser degree of what had showed at the $2k level.
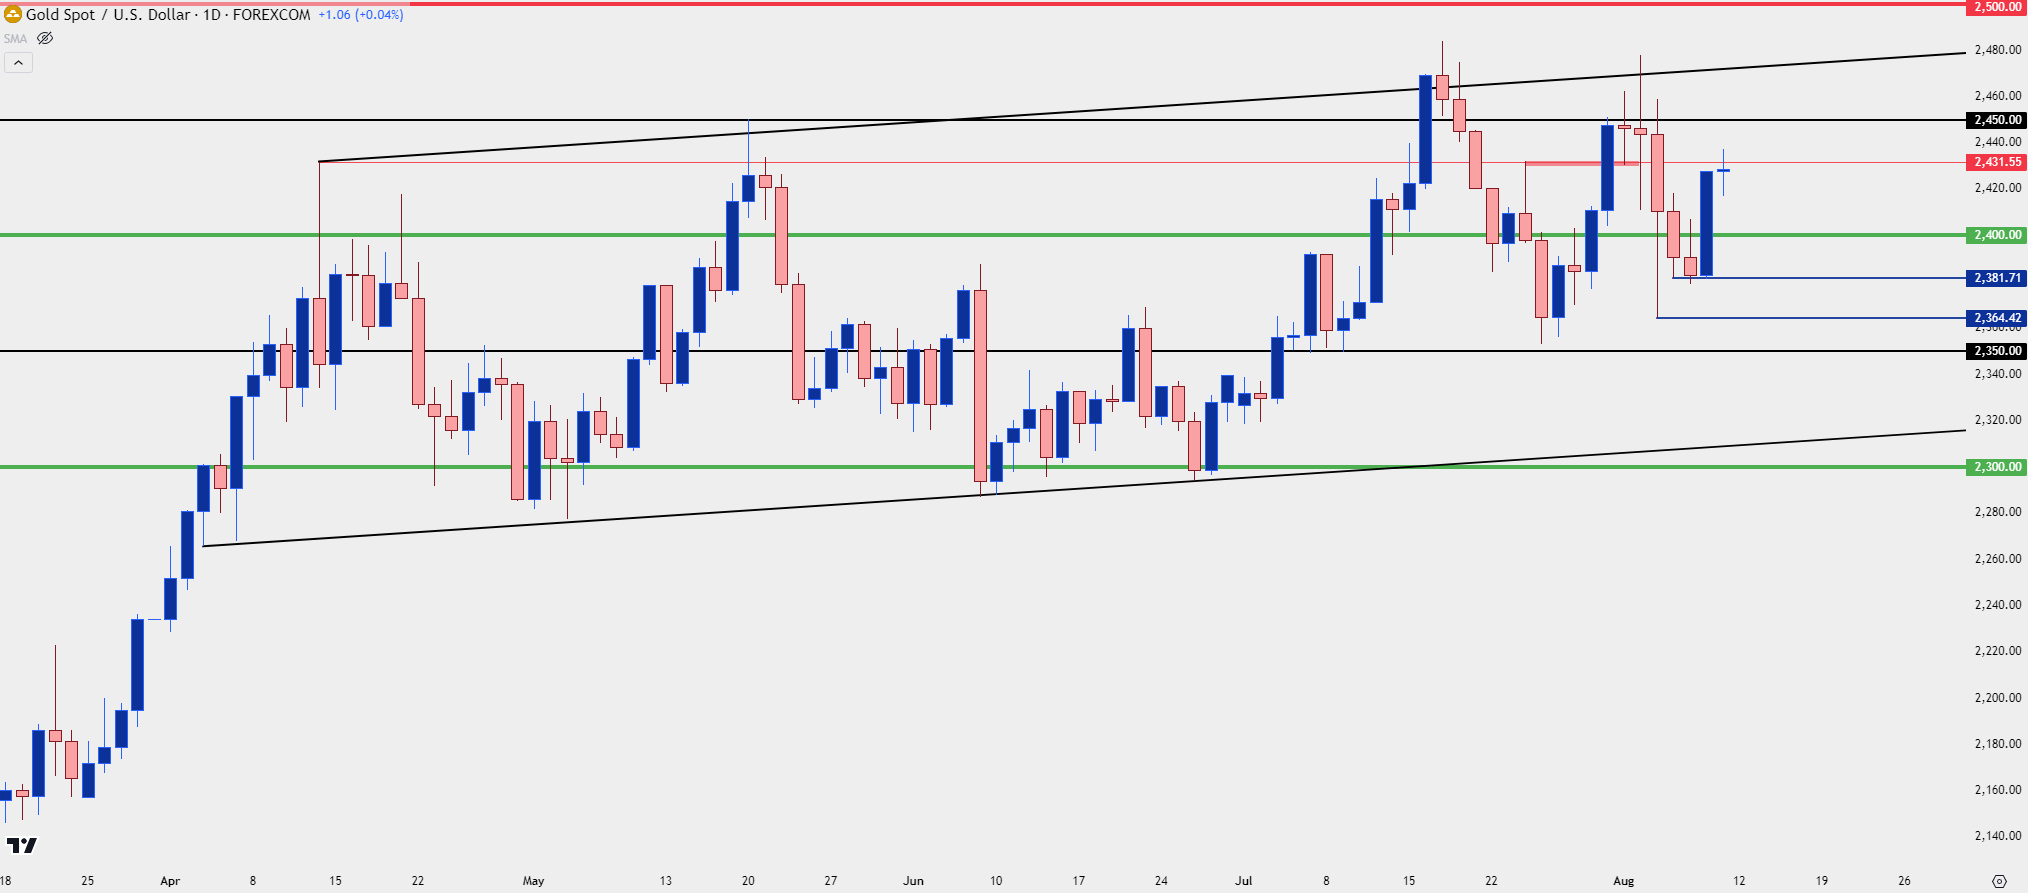
Gold Daily Price Chart
 Chart prepared by James Stanley; data derived from Tradingview
Gold Shorter-Term, Strategy
In the linked video above, I had highlighted the importance of $2,431, which was the swing high in April. But it’s the context of what’s been taking place inside of $2,500 that’s important, as we’ve seen bulls show increasing trepidation on moves approaching that big figure. So far that’s built a lower-high and this maybe a product of still one-sided sentiment in the pair, especially given the fact that a deeper retracement of the March/April breakout hasn’t yet shown.
But bulls aren’t out of business yet as there’s been an increasing acceptance of prices above these psychological levels and we can even draw down to minor psychological levels at $2,350 and $2,450 for more granular indications. The $2,350 level helped to mark the swing-low after the July open, and $2,450, which was resistance in May, as yielded to additional tests over the past few weeks.
The risk here in my opinion would be one of competition, something that could compel some of those longer-term bulls to close positions and look elsewhere. I think we saw a glimpse of that as panic was taking over a couple weeks ago and this can be explained by the surge in Treasury prices as markets began to price in more rate cuts from the Fed. On that – the US CPI report next week is highly important.
At this point, I retain a bullish bias given the hold of higher-lows last week combined with the big-picture backdrop looked at in the prior two charts.
Gold Four-Hour Price Chart
 Chart prepared by James Stanley; data derived from Tradingview
--- written by James Stanley, Senior Strategist


