Gold, XAU/USD Talking Points:
- It was the strongest week for Gold since the first week of April, which was the week before the current all-time-high was set.
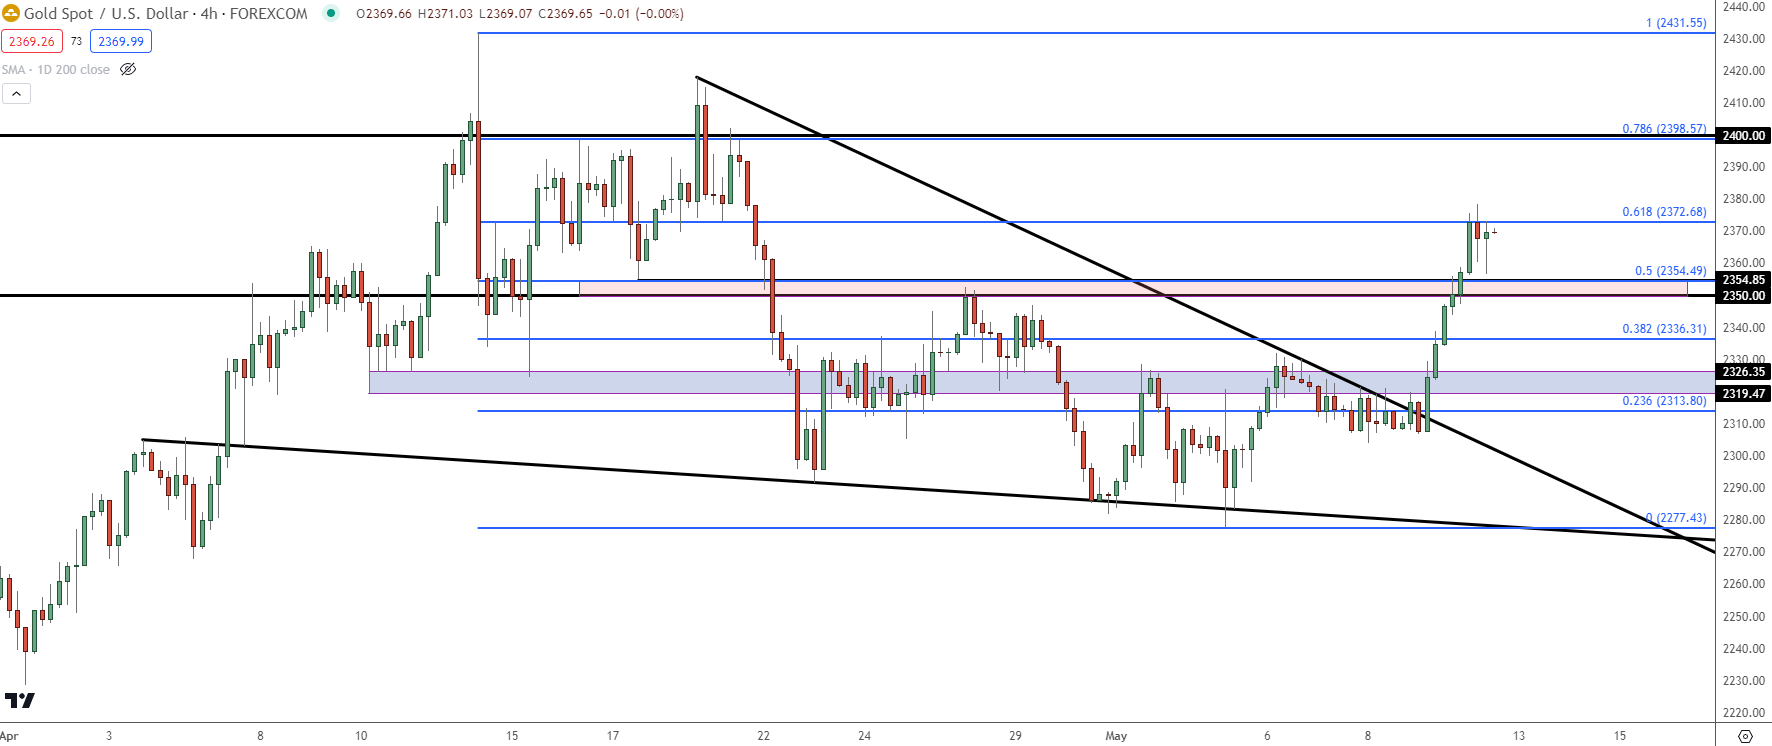
- The pullback over the past month was uneven, showing as a falling wedge formation. Those are often approached with aim of bullish breakout, which took place this week. Bulls drove directly through 2350-2354 and they retain control as we move into next week. The highlight on the calendar is the Wednesday CPI release, which can have a big impact on the US Dollar.
- I’ll be discussing these themes in-depth in the weekly webinar. It’s free for all to register: Click here to register.
Gold bulls got back in the driver’s seat this week in a very big way. The bulk of the move was relegated to the final two days of the week, but it was a clear and decisive breakout of the formation that’s brewed since the all-time-high was set in early-April.
I looked into this in the Tuesday webinar and at the time, Gold was holding support at 2309 as wedge resistance remained overhead. The breakout started to hit on Thursday, and as you can see from the below chart the run past 2319-2326 resistance was fast and aggressive, all the way into 2372.68 which is the 61.8% Fibonacci retracement of the pullback move.
Gold (XAU/USD) Four-Hour Price Chart
 Chart prepared by James Stanley, Gold on Tradingview
Gold: The $2400 Problem
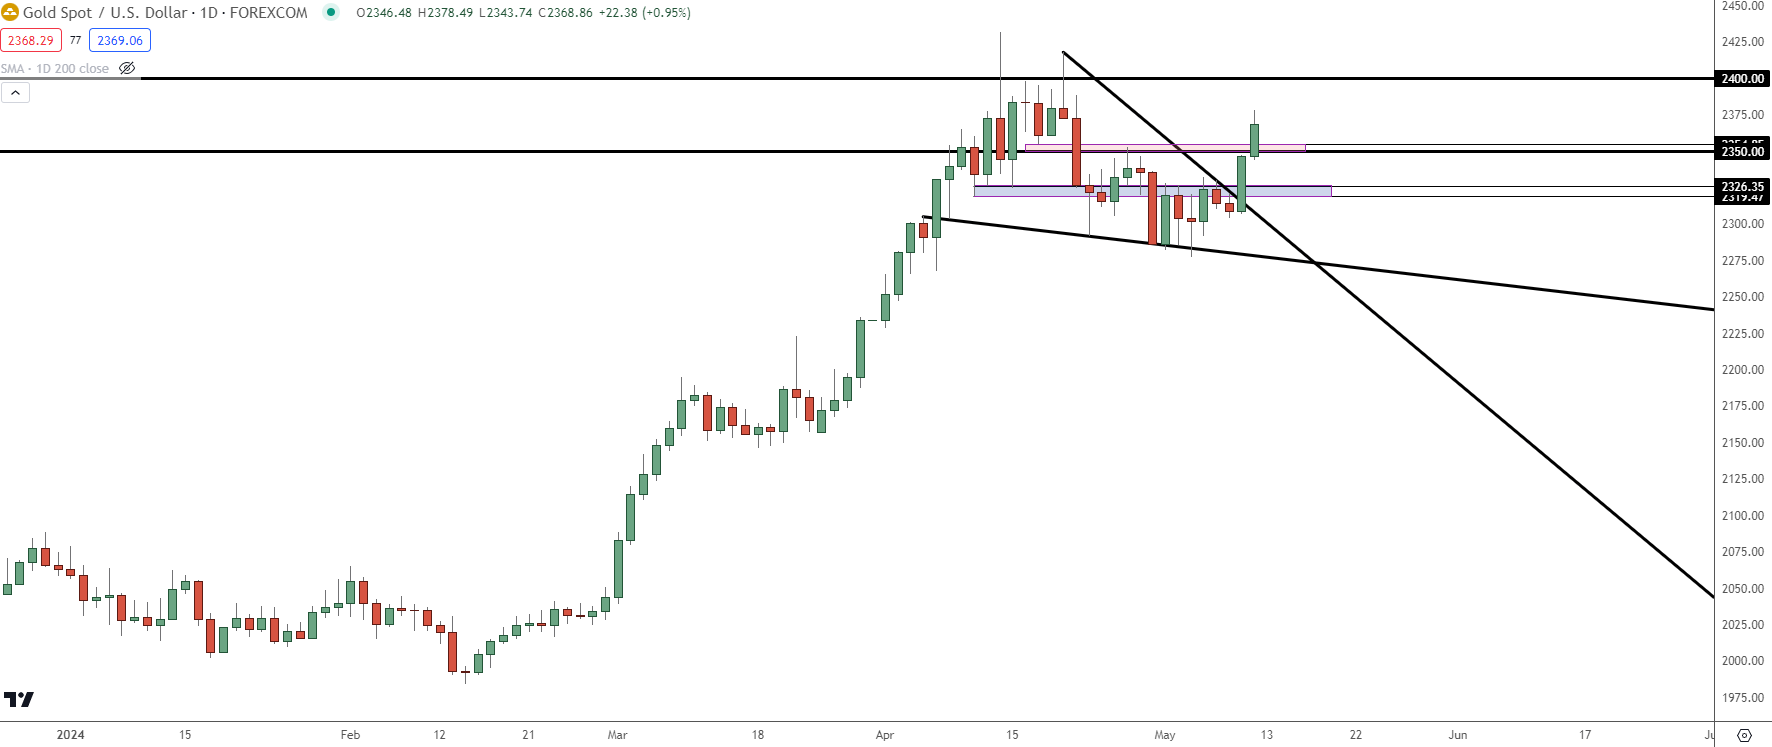
At this point price is charging back towards the April highs, and from that backdrop the big question is whether buyers have enough motivation to push a lasting break above the $2400 psychological level.
There were two attempted breakouts at that price in April and both failed, with the second leading to a lower-high which was followed by deeper pullback. At the time of the first test above $2400, Gold had moved into extreme overbought territory as weekly RSI was making a fast move towards the 80-level.
Gold Daily Price Chart
 Chart prepared by James Stanley, Gold on Tradingview
Gold Shorter-Term Strategy
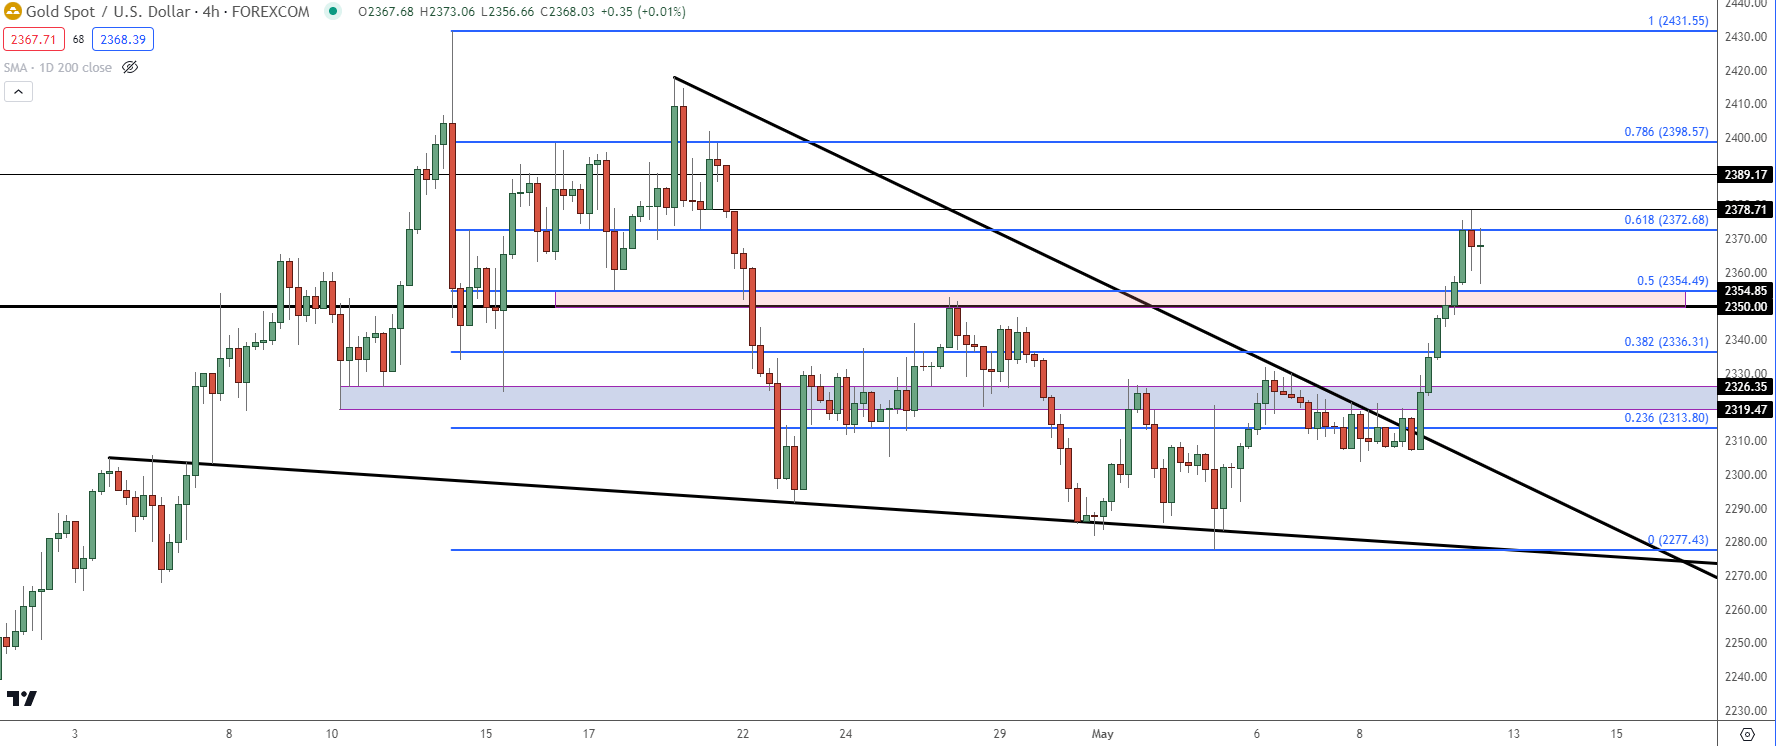
At this point Gold prices have jumped up to a fresh higher-high and the question now is whether bulls can hold a higher-low. There’s a couple of spots of interest for such a look and with the CPI release scheduled for next Wednesday, there remains the possibility of significant motivation on either side of the move. If inflation comes out soft, that could give a shot-in-the-arm to rate cut themes around the Fed, which could invigorate the topside of Gold, perhaps even leading to a fresh ATH and a move towards the $2,500 level. But – if Core CPI prints at 3.8% or higher, similar fears of inflation entrenchment could rear their ugly head and the same fear that was driving in the back-half of April could quickly come back into play.
The 50% mark of the pullback move plots at 2354 which was also a prior swing low in mid-April, and that spans down to 2350 to create a support zone of note. Below that is the 38.2% retracement and that’s confluent with prior resistance and that similarly could remain of interest for higher-low support. But – even if price drives all the way down to 2319-2326, there could be a case to be made for support at prior resistance as that spot had stymied bulls for two weeks before finally giving in to breakout this week.
Gold (XAU/USD) Four-Hour Price Chart
 Chart prepared by James Stanley, Gold on Tradingview
--- written by James Stanley, Senior Strategist


