Gold, XAU/USD Talking Points:
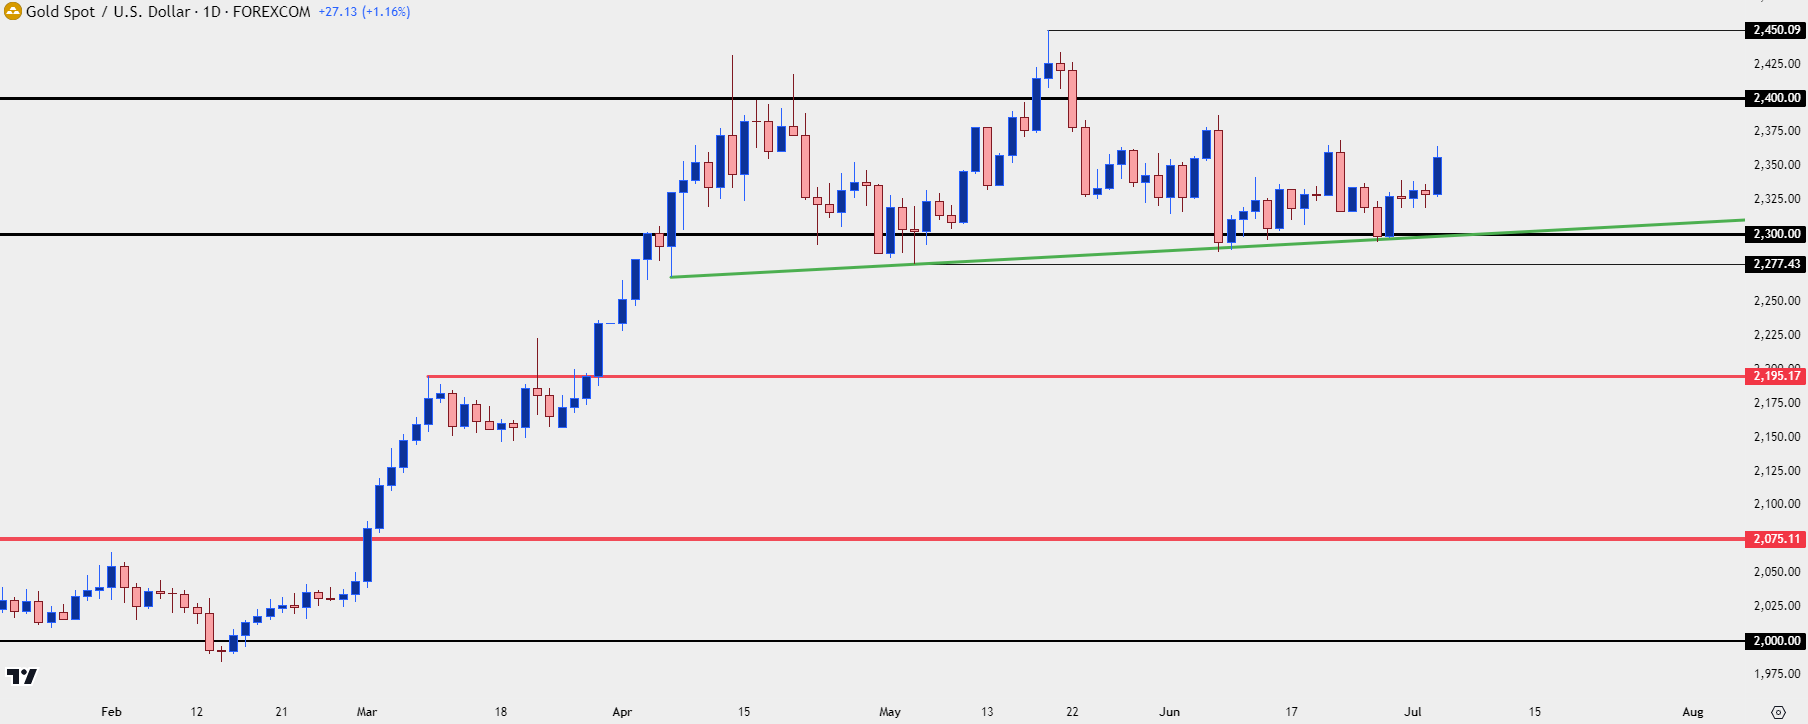
- Gold spent the entirety of last quarter in a range and as that range built, so did a couple of bearish formations in the form of a descending triangle and a head and shoulders pattern.
- As I discussed in the Tuesday webinar, both formations require breaches of support to trigger, and through Q2 bulls continued to hold support around the $2300 level which kept bears at bay and bulls in-control. To kick off Q3 buyers have made a strong push.
- There’s a bullish trendline connecting swing lows from Q2, presenting a case of ‘bulls are in control until evidence suggests otherwise,’ which I’m tracking from the upward-sloping trendline.
- I’ll be discussing these themes in-depth in the weekly webinar. It’s free for all to register: Click here to register.
Gold has started off Q3 with a bang, and that comes in contrast to much of last quarter as gold prices built in a range after a strong breakout in March. That range backdrop is well-illustrated on the below weekly chart and notice how aggressively overbought RSI was in the first couple weeks of last quarter as bulls cooled their aggression.
Gold Weekly Price Chart
 Chart prepared by James Stanley, Gold on Tradingview
Gold Daily
That overbought backdrop in gold arrived after a strong move in the month of March, helped along by a dovish FOMC meeting where the bank held expectations for two to three cuts in 2024. And despite going deeply into overbought conditions in the first couple weeks of Q2 trade, support held for much of the period around the $2300 level, along a bullish trendline connecting swing lows from April and May, shown in green on the below chart.
Gold Daily Price Chart
 Chart prepared by James Stanley, Gold on Tradingview
Gold Strategy
A strong trend starting to stall will often be approached with aim of pullback potential. And given the size of the breakout and where it took place, there remains an ideal spot for a higher-low support test to show on a longer-term basis. The $2,075-$2,089 zone held the highs in gold for more than three years before finally giving way and the breakout that prodded that move was aggressively bullish, which explains the RSI reading from the above weekly chart.
As this happened, there was the build of multiple bearish formations, including a head and shoulders pattern along with a descending triangle. The latter formation has been nullified with the Q3 breakout but the former remains a possibility.
In both cases, however, bears would need to make a push below support and that’s the item that was missing for the entirety of the last quarter. This keeps bulls in the driver’s seat as what we have at this point is a bullish trend that’s shown adherence to higher-low supports.
This can change, of course, but the fact that bulls haven’t been more aggressive with profit taking, to the degree that higher-low supports continued to build throughout the quarter, illustrates the fact that there’s still bullish sentiment remaining in gold markets.
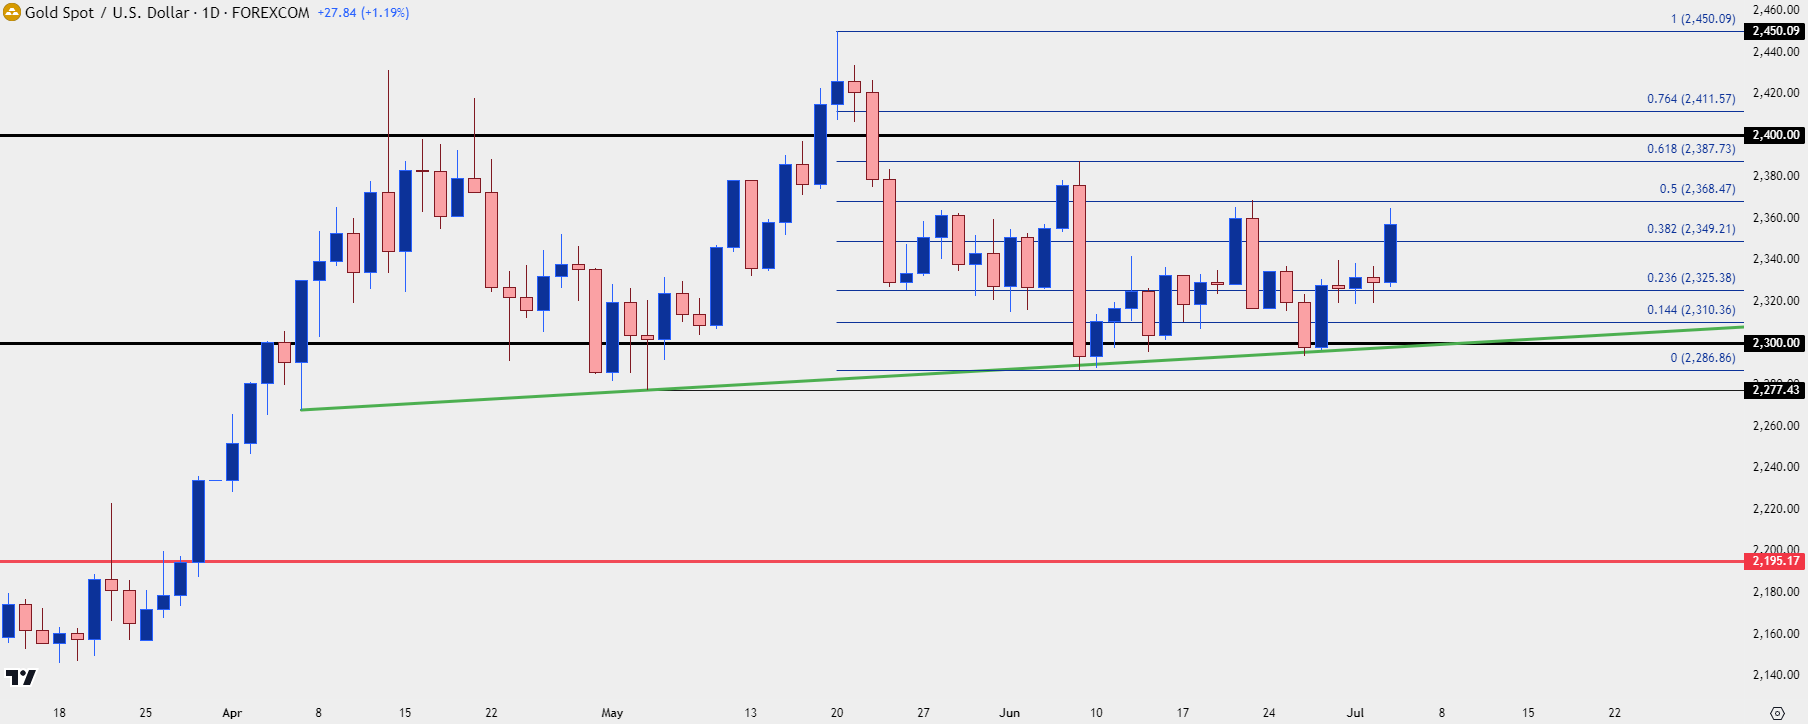
The big test now is the one that buyers were unable to overcome in June, and that’s whether bulls can power through resistance as there remains a series of lower-highs after the test of $2450.
On the below daily chart, we can see the 50% retracement of the Q2 range plotted at $2368.47, which also held the most recent lower-high. That becomes a big test for bulls in continuation scenarios and if they can power through that, the prior lower-high shows at the 61.8% retracement of that move at $2387.
And after that bulls still have some tests to encounter, namely the $2400 psychological level which, from the daily chart below, shows a lack of acceptance thus far.
Gold Daily Price Chart
 Chart prepared by James Stanley, Gold on Tradingview
--- written by James Stanley, Senior Strategist


