Gold Technical Forecast: XAU/USD Weekly Trade Levels
- Gold surges for a third consecutive week- rallies more than 8.3% off yearly low
- XAU/USD breach of key resistance / 2023 yearly opening-range now testing record high
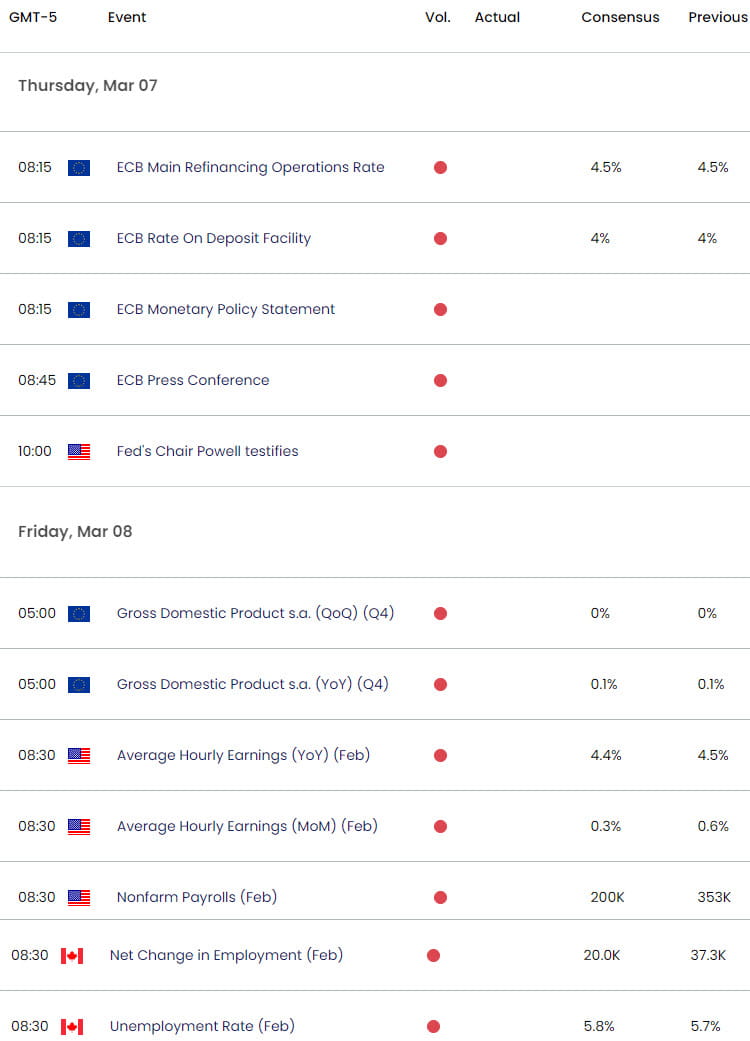
- Major event risk on tap this week – Powell testimony, ECB, US Non-Farm Payrolls
- Resistance 2146, 2180 (key), 2277 – Support 2115, 2075/81, 2004
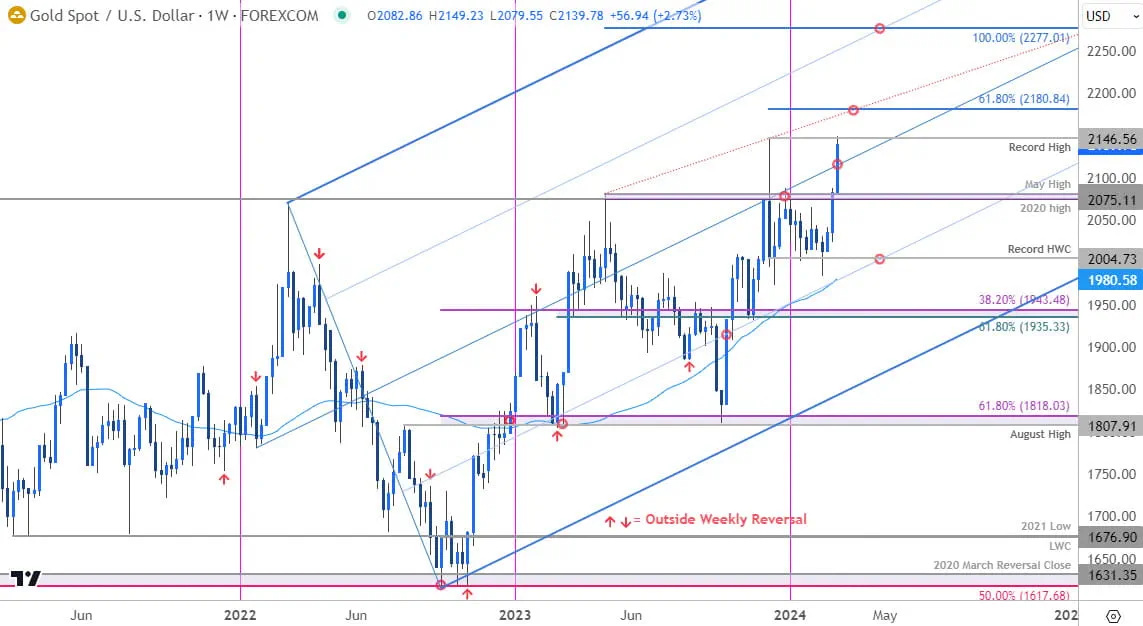
Gold prices ripped back into the record highs today with a three-week rally breaking major technical resistance this week. The breach marks a breakout of the yearly opening-range and keeps the broader outlook weighted to the topside in the months ahead. That said, the immediate advance is now approaching initial resistance hurdles and the focus is on possible topside exhaustion / price inflection near-term. These are the updated targets and invalidation levels that matter on the XAU/USD weekly technical this month.
Review my latest Weekly Strategy Webinar for an in-depth breakdown of this gold setup and more. Join live on Monday’s at 8:30am EST.
Gold Price Chart – XAU/USD Weekly

Chart Prepared by Michael Boutros, Sr. Technical Strategist; XAU/USD on TradingView
Technical Outlook: In my last Gold Weekly Price Forecast we noted that XAU/USD had, “set the January range just below confluent resistance and the focus is on a breakout for guidance. From at trading standpoint, we are looking to confirm an exhaustion low – losses should be limited by 1960 for the October advance to remains viable with a breach / close above 2081 needed to fuel the next leg higher in price.”
The range held into mid-February with price registering an intraweek low at 1984 before reversing sharply higher into March. Gold has now rallied more than 8.3% off those lows with a breakout of key resistance at the yearly opening-range highs now poised to mark the largest weekly range since early-December.
Initial weekly resistance is being tested today at the former record high near 2146 with the 61.8% Fibonacci extension of the October advance just higher at 2180- look for a larger reaction there IF reached. Ultimately, a breach / close above this threshold is needed to fuel the next leg higher in price towards 2277.
Look for initial support along the median-line (currently ~2115) backed by former resistance at the 2020 & 2023 swing highs around 2075/81. Broader bullish invalidation now raised to the December high-week close at 2004.
Bottom line: Gold has broken out of the yearly opening-range / key resistance pivot with the rally now extending into the record highs. From at trading standpoint, a good zone to raise protective stops- look to reduce portions of long exposure on a stretch towards 2180. Losses should be limited to 2075 IF price is heading higher with a close above the 2023 trendline needed to unleash the next major thrust higher.
Keep in mind we are just setting the March opening-range now with Fed Chair Powell’s semi-annual testimony before congress and US non-farm payrolls on tap into the close of the week. Stay nimble here and watch the weekly close, the potential for a larger washout rises IF price fails to close above resistance here. I’ll publish an updated Gold Short-term Outlook once we get further clarity on the near-term XAU/USD technical trade levels.
Key Economic Data Releases

Economic Calendar - latest economic developments and upcoming event risk.
Active Weekly Technical Charts
- British Pound (GBP/USD)
- Euro (EUR/USD)
- Australian Dollar (AUD/USD)
- US Dollar Index (DXY)
- Japanese Yen (USD/JPY)
- Canadian Dollar (USD/CAD)
--- Written by Michael Boutros, Sr Technical Strategist with FOREX.com
Follow Michael on X @MBForex


