Gold technical forecast: XAU/USD weekly trade levels
- Gold prices reverse sharply off confluent trend resistance
- XAU/USD at risk for further short-term losses
- Gold resistance 1927, 1959, 1988– support 1807/28 (key)
Gold prices plunged from key technical resistance last week and while the broader outlook remains weighted to the topside, the precious metal may be vulnerable to a deeper correction in the days ahead. These are the updated targets and invalidation levels that matter on the XAU/USD weekly technical chart. We’ll be discussing this gold setup and more in the Weekly Strategy Webinars beginning February 27th!
Gold Price Chart – XAU/USD Weekly

Chart Prepared by Michael Boutros, Technical Strategist; XAU/USD on TradingView
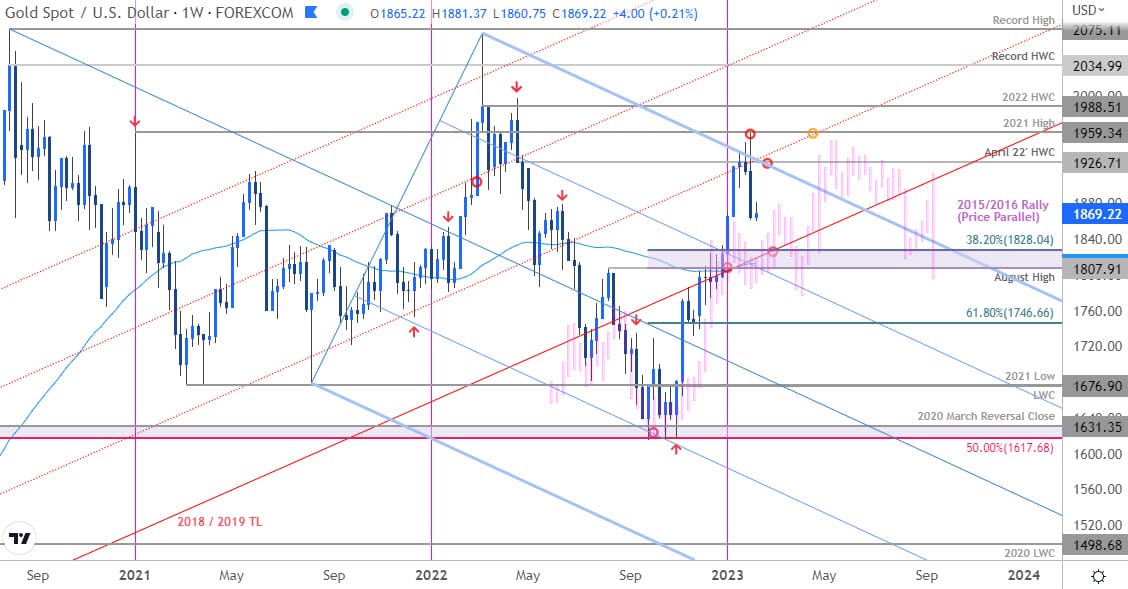
Technical Outlook: Gold prices rallied a staggering 20% off the September/October lows with the advance taking XAU/USD from downtrend support, up into downtrend resistance last week. A massive outside-candle plunged more than 5% off the highs and marks the largest single-week decline since October & the largest weekly range since November. The reversal off confluent resistance now threatens a larger pullback within the broader uptrend and we’re looking for a possible exhaustion-low in the weeks ahead.
Confluent resistance stands with the April 2022 high-week reversal close at 1927 with a breach / weekly close above the 2021 high at 1959 needed to mark resumption of the broader uptrend.
Critical support rests at 1807/28- a region defined by the August swing high, the 52-week moving average, the objective yearly open and the 38.2% retracement of the September advance. We’ll reserve this threshold as our bullish invalidation level and remains an area of interest for possible downside exhaustion / price inflection IF reached.
Gold Price Chart – XAU/USD Weekly (2016 Price Parallel)

Note that a parallel of the late-2016 advance off multi-year lows (pink) suggests a period of consolidation here before a retest of the highs. For context, that instance took 30-weeks before finally peaking for a larger correction – this currently rally off the September lows is on week 19.
Bottom line: Gold prices have reversed off confluent resistance and threatens a deeper correction in the weeks ahead. From a trading standpoint, losses should be limited to 1807/28 IF price is to respect the January breakout. A topside breach of this key resistance threshold would expose subsequent objectives towards the record highs. I’ll publish an updated Gold short-term technical outlook once we get further clarity on the near-term technical trade levels.
Key Economic Data Releases

Economic Calendar - latest economic developments and upcoming event risk.
--- Written by Michael Boutros, Sr Technical Strategist with FOREX.com
Follow Michael on Twitter @MBForex


