Gold Technical Forecast: XAU/USD Weekly Trade Levels
- Gold plummets more than 2% - five-day decline now testing multi-month lows
- Risk for deeper correction remains – key technical support pivot in view
- Gold resistance 1943, 1988, 2017 – support 1891-1903 (key), ~1850s, 1823/31
Gold prices are poised for a second weekly decline with XAU/USD now threatening the largest single-week loss since the January high-week reversal. A break of multi-month uptrend support now threatens a larger sell-off with a major technical support-hurdle now in view. These are the updated targets and invalidation levels that matter on the XAU/USD weekly technical chart.
Review my latest Weekly Strategy Webinar for an in-depth breakdown of this crude oil setup and more. Join live on Monday’s at 8:30am EST.
Gold Price Chart – XAU/USD Weekly

Chart Prepared by Michael Boutros, Technical Strategist; XAU/USD on TradingView
Technical Outlook: In last month’s Gold Weekly Price Forecast we noted that XAU/USD had,” plunged more than 7% off those highs with a three-week decline now testing confluent support around the 50% retracement / 2022 channel at ~1943 (intraday low registered at 1932). The focus now shifts on a possible exhaustion low heading into the start of June.” Gold failed to close below this support zone for four-weeks with this latest attempt now gaining traction.
The next major support zone is now within striking distance at 1891-1903- a region defined by the May 2021 high week close and the 38.2% Fibonacci retracement of the entire September rally- look for a larger reaction there IF reached. A break / weekly close below this threshold would threaten a larger-scale correction towards the highlighted slope confluence near ~1850s and the objective yearly open / 52-week moving average at 1823/31.
Initial resistance now eyed back at 1943 backed by the 2022 high-week close at 1988. Ultimately a breach / close above the record high-week close at 2017 would be needed to validate resumption of the broader uptrend towards the record high-close at 2034 and 2075/81.
Bottom line: Gold has broken the 2022 September uptrend and remains vulnerable to further losses. From at trading standpoint, look to reduce short-exposure / lower protective stops on a stretch towards 1891-1903 – rallies should be limited to 1943 IF price is indeed heading lower on this stretch. Review my latest Gold Short-term Technical Outlook for a closer look at the near-term XAU/USD technical trade levels.
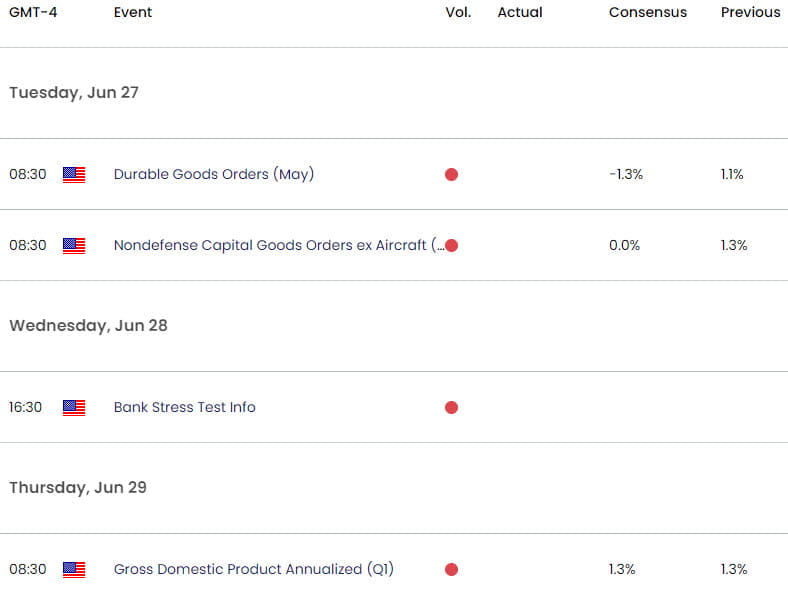
Key Economic Data Releases

Economic Calendar - latest economic developments and upcoming event risk.
Active Weekly Technical Charts
- Canadian Dollar (USD/CAD)
- Euro (EUR/USD)
- Japanese Yen (USD/JPY)
- Australian Dollar (AUD/USD)
- British Pound (GBP/USD)
- US Dollar (DXY)
- Crude Oil (WTI)
--- Written by Michael Boutros, Sr Technical Strategist with FOREX.com
Follow Michael on Twitter @MBForex


