Gold Technical Forecast: XAU/USD Weekly Trade Levels
- Gold prices struggle into multi-year uptrend resistance- ongoing momentum divergence
- XAU/USD sets August opening-range just below resistance- pending breakout ahead
- Resistance 2443, 2483, 2516 – Support ~2366, 2333, 2278/93(key)
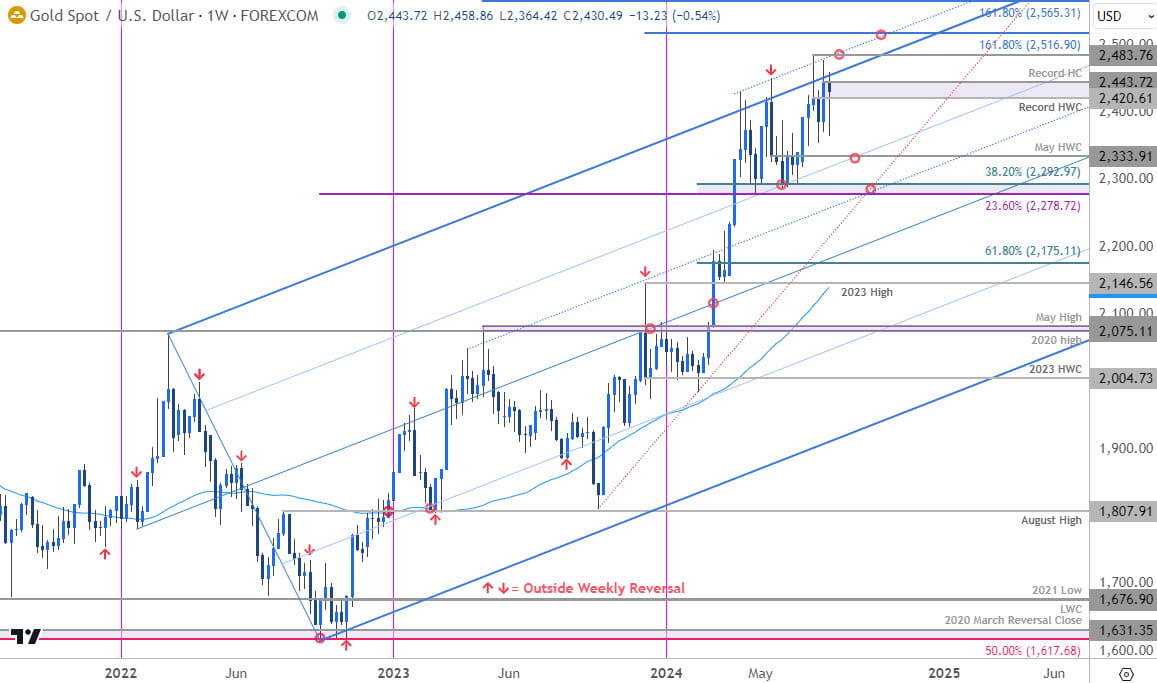
Gold prices are poised to close the week down 0.4% despite a weekly range of nearly 4% as the bulls struggle into multi-year uptrend resistance. The immediate focus is on a breakout to the August opening-range with the broader uptrend still vulnerable while below the record highs. These are the update targets and invalidation levels that matter on the XAU/USD weekly technical chart.
Review my latest Weekly Strategy Webinar for an in-depth breakdown of this gold setup and more. Join live on Monday’s at 8:30am EST.
Gold Price Chart – XAU/USD Weekly

Chart Prepared by Michael Boutros, Sr. Technical Strategist; XAU/USD on TradingView
Technical Outlook: In last month’s Gold Weekly Price Forecast we noted that XAU/USD had, “failed a third attempt to breach uptrend resistance and while the broader outlook remains constructive, the immediate advance may be vulnerable here while below this slope.” Gold has now made two more failed attempts to breach this slope and the outlook remains the same here as the bulls struggles into uptrend resistance. Note that price has continued to mark ongoing momentum divergence into these highs with last week posting a fourth reference point on weekly RSI.
Gold is poised to close at weekly resistance around a key technical confluence at 2420/43- a region defined by the record high-week close and the record high-close. Ultimately, a breach / weekly close above the sliding parallel (dotted blue line) around the record highs at 2483 is needed to fuel the next leg towards subsequent resistance objectives at the 1.618% extension of the October rally at 2516 and the 1.618% extension of the broader 2022 rally at 2565.
Weekly support rests with the May high-week close (HWC) at 2333 and is backed by a more significant technical confluence at 2278/93- a region defined by the 23.6% retracement of the broader 2022 advance and the 38.2% Fibonacci retracement of the 2024 yearly range. A break / weekly close below this threshold would be needed to suggest a more significant high was registered last month / a larger correction is underway towards the median line (currently ~2200).
Bottom line: Gold prices have continued to struggle at long-term uptrend resistance and while the broader outlook is still constructive, the immediate advance remains vulnerable while below this upslope. From a trading standpoint, the immediate focus is on a breakout of the objective August opening-range (2366-2470) for guidance here with the medium-term threat still for a corrective pullback off while below uptrend resistance.
That said, this is a strong uptrend, and a topside breach could fuel another accelerated run to fresh highs- stay nimble here and watch the weekly closes. I’ll publish an updated Gold Short-term Outlook once we get further clarity on the near-term XAU/USD technical trade levels.
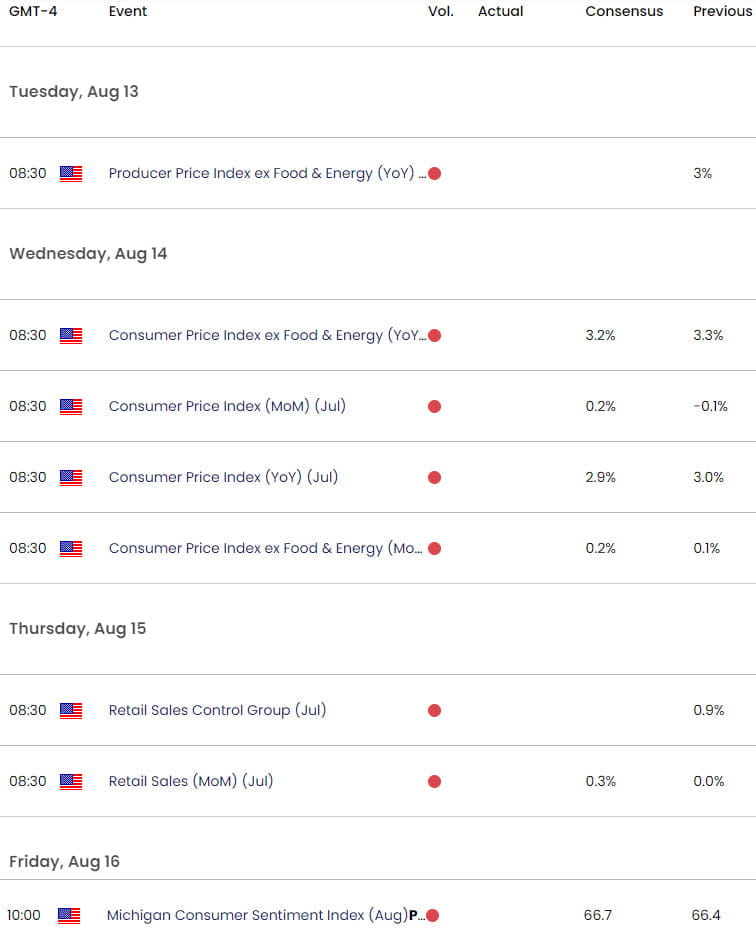
Key US Economic Data Releases

Economic Calendar - latest economic developments and upcoming event risk.
Active Weekly Technical Charts
- Australian Dollar (AUD/USD)
- Canadian Dollar (USD/CAD)
- US Dollar Index (DXY)
- Japanese Yen (USD/JPY)
- Euro (EUR/USD)
- British Pound (GBP/USD)
- Crude Oil (WTI)
--- Written by Michael Boutros, Sr Technical Strategist with FOREX.com
Follow Michael on X @MBForex


