Gold Technical Forecast: XAU/USD Weekly Trade Levels
- Gold turns from uptrend resistance at fresh record highs- down more than 5%
- XAU/USD threatens to deeper correction within yearly uptrend- NFPs on tap
- Resistance 2415/31, 2516, 2565 – Support ~2300, 2253/60 (key), 2145/55
Gold remained on the defensive this week with XAU/USD trading at 2340 ahead of the New York close on Friday. A massive reversal off technical resistance last week remains in focus with gold threatening a deeper correction within the broader uptrend. These are the update targets and invalidation levels that matter on the XAU/USD weekly technical chart heading the June open.
Review my latest Weekly Strategy Webinar for an in-depth breakdown of this gold setup and more. Join live on Monday’s at 8:30am EST.
Gold Price Chart – XAU/USD Weekly

Chart Prepared by Michael Boutros, Sr. Technical Strategist; XAU/USD on TradingView
Technical Outlook: In my last Gold Weekly Price Forecast we noted that XAU/USD had, “rallied more than 20% off the yearly lows and while the rally is maturing here, the broader outlook remains weighted to the topside for now. That said, be on the lookout for signs of possible price inflection into the upper parallels just higher.” The gold rally continued the following week with price registering a fresh record intraweek high at 1450 before reversing sharply lower – an outside weekly reversal last week marked the largest weekly decline since December (that instance marked the monthly highs). Gold is now off more than 5% from the highs with a break below the median-line threatening further losses here. The focus in the start of June is on this pullback within the broader uptrend.
Initial weekly support rests at 2300 backed by the 23.6% retracement of the 2022 advance / the 38.2% retracement of the yearly range at 2253/60- losses should be limited this threshold IF price is heading higher on this stretch. Broader bullish invalidation now raised to the 2023 high/ 61.8% Fibonacci retracement at 2146/55.
Initial resistance stands with the record high-close (HC) / April highs at 2415/31 – note that the upper parallel converges on this threshold and further highlights its technical significance over the next few weeks. A topside breach / weekly close above is needed to mark resumption of the uptrend towards subsequent resistance objectives at the 1.618% extension of the October rally at 2516 and the 1.618% extension of the broader 2022 advance at 2565- look for a larger reaction there IF reached.
Bottom line: Gold prices have reversed off uptrend resistance and remain at risk for a deeper correction towards trend support. From a trading standpoint, we’ll be on the lookout for an exhaustion low in the weeks ahead- losses should be limited to 2238 IF price is heading higher on this stretch with a weekly close above 2431 ultimately needed to fuel the next leg higher in price.
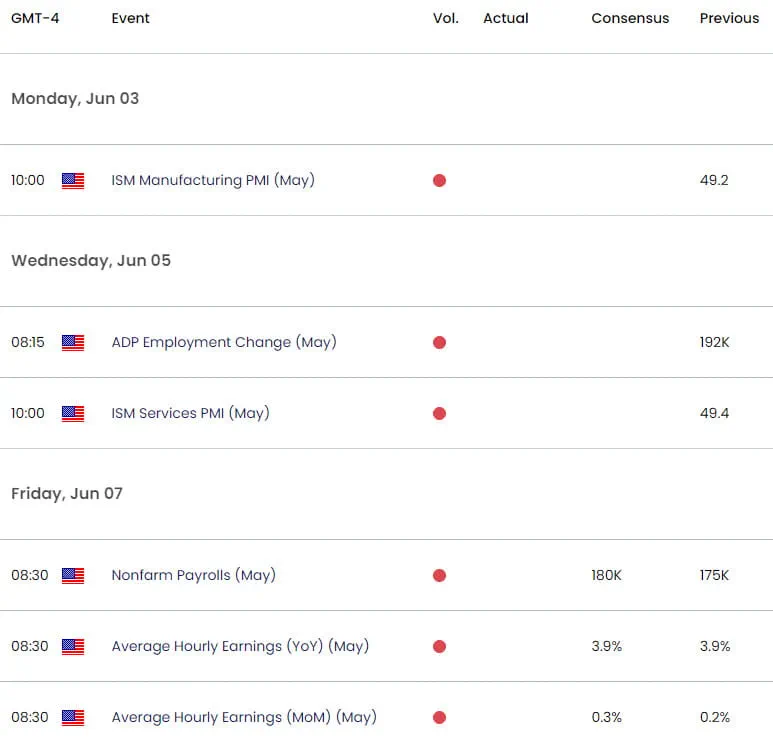
Keep in mind that we are heading into the June open with US non-farm payrolls (NFP) on tap Friday. Stay nimble into the monthly cross and watch the weekly closes for guidance. I’ll publish an updated Gold Short-term Outlook once we get further clarity on the near-term XAU/USD technical trade levels.
Key US Economic Data Releases

Economic Calendar - latest economic developments and upcoming event risk.
Active Weekly Technical Charts
- Euro (EUR/USD)
- British Pound (GBP/USD)
- Crude Oil (WTI)
- Australian Dollar (AUD/USD)
- Canadian Dollar (USD/CAD)
- US Dollar Index (DXY)
--- Written by Michael Boutros, Sr Technical Strategist with FOREX.com
Follow Michael on X @MBForex


