Gold Technical Forecast: XAU/USD Weekly Trade Levels
- Gold snaps two-week rally into former trend support- September opening-range in focus
- XAU/USD threat for exhaustion low in the weeks ahead- FOMC looming
- Resistance 1960, 1988, 2006/16 – Support 1915, 1891, 1870/71
Gold prices are down nearly 1.9% off the monthly high with XAU/USD paring a portion of the mid-August rally. The stage is set heading into the FOMC rate decision this month and its make-or-break for the bulls as gold tests former support. These are the updated targets and invalidation levels that matter on the XAU/USD weekly technical chart.
Review my latest Weekly Strategy Webinar for an in-depth breakdown of this gold setup and more. Join live on Monday’s at 8:30am EST.
Gold Price Chart – XAU/USD Weekly

Chart Prepared by Michael Boutros, Technical Strategist; XAU/USD on TradingView
Technical Outlook: In last month’s Gold Weekly Price Forecast we noted that XAU/USD was, “testing a pivot zone here at multi-month uptrend support with the August opening-range taking shape just above- look to the breakout for guidance.” The focus was on a reaction into the November trendline (red) and we noted that, “a break below this key pivot zone would threaten another accelerated decline towards the Mary 2021 high-week close at 1891 and the 61.8% extensions of the yearly a decline at 1871.” Gold plunged lower the following week with price registering an intraweek low at 1884 before rebounding. Was that the low? Or is there yet one last washout left to complete a proper correction off the yearly high?
An outside-weekly reversal off the lows rallied more than 3.6% before faltering last week at former trend support (now resistance). The battle lines are drawn with the immediate focus on a breakout of the September opening-range.
Weekly resistance is eyed at 1960 and is backed by the July high / 2022 high-week close at 1987/88. Ultimately a breach / weekly close above the key resistance at the 61.8% Fibonacci retracement of the May decline / record high-week close at 2006/16 is needed to mark resumption of the broader uptrend.
Initial support rests with the August low-week close at 1915 and the May 2021 high-week close at 1891. A key support confluence rests just lower at the 61.8% extensions of the yearly a decline / 52-week moving average at 1870/71- an area of interest for possible downside exhaustion / price inflection IF reached.
Bottom line: From a trading standpoint, we head into September looking to confirm an exhaustion low in price – the immediate focus is on a breakout of the monthly opening-range for guidance here. Note that the threat remains for a test of parallel support near 1870 while below 1960. Stay nimble in to the FOMC rate decision in less than two-weeks with the release of the updated economic projections and interest rate dot-plot likely to fuel added volatility here. I’ll publish an updated Gold Short-term Technical Outlook once we get further clarity on the near-term XAU/USD technical trade levels.
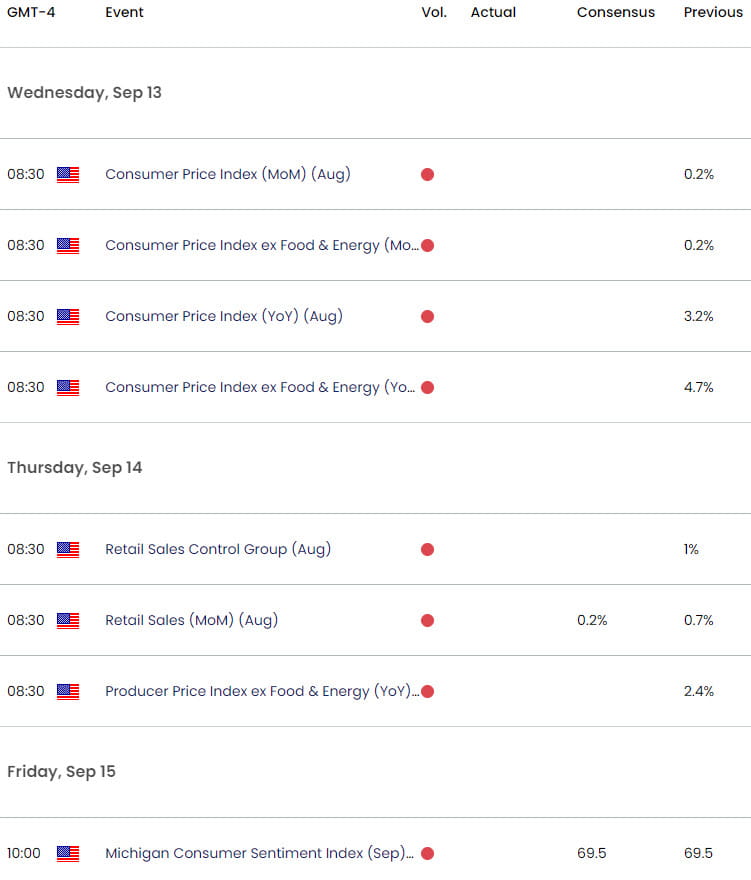
Key Economic Data Releases

Economic Calendar - latest economic developments and upcoming event risk.
Active Weekly Technical Charts
- Euro (EUR/USD)
- Canadian Dollar (USD/CAD)
- British Pound (GBP/USD)
- Australian Dollar (AUD/USD)
- Japanese Yen (USD/JPY)
- Crude Oil (WTI)
- US Dollar (DXY)
--- Written by Michael Boutros, Sr Technical Strategist with FOREX.com
Follow Michael on Twitter @MBForex


