
Gold Talking Points:
- Gold bulls have driven a massive move of strength, with a breach of the $2400 level showing last Friday although that move was quickly pared back.
- So far this week, we’ve seen bulls very active on pullbacks or near support, but they haven’t yet been able to push a re-test of the $2400 level, begging the question as to whether a pullback is close to appearing.
- I’ll be discussing these themes in-depth in the weekly webinar on Tuesday. It’s free for all to register: Click here to register.
With a move as loud and visible that we’ve seen in Gold, it can be difficult to draw fresh shorts into the market. Sure, there’s several items that suggest the move is overbought, but for a trader to take the risk of fading what’s been one of the strongest trends that the gold market has shown over the past 20 years, that can be a difficult prospect. There’s also the subject of drivers to consider, as this move hasn’t happened without motivation on the fundamental side.
But, if price begins to stall at those highs, the attractiveness of reversal setups could grow. And that could draw bears into the market to begin to offer prices lower. If bulls are exhausted then those support levels may not be as attractive as they were just a couple of days or a week ago, and that’s what can start pullback scenarios in even strong, bullish trends.
But, the stall can often come from long positions taking profit and that can become somewhat of a self-fulfilling ordeal, where other longs see prices stalling as others are taking profits; and then they, too, are encouraged to tighten up their position before a deeper pullback may show.
At this stage Gold has stalled for the past week around the $2,400 level. That price traded last Friday, and bulls even ran the break above that price for a little over an hour and a half. And so far this week, gold has come close to a re-test, but each move towards $2400 has been faded and that, again, illustrates the possibility of profit taking as the move has begun to show stall.
Gold (XAU/USD) Hourly Price Chart
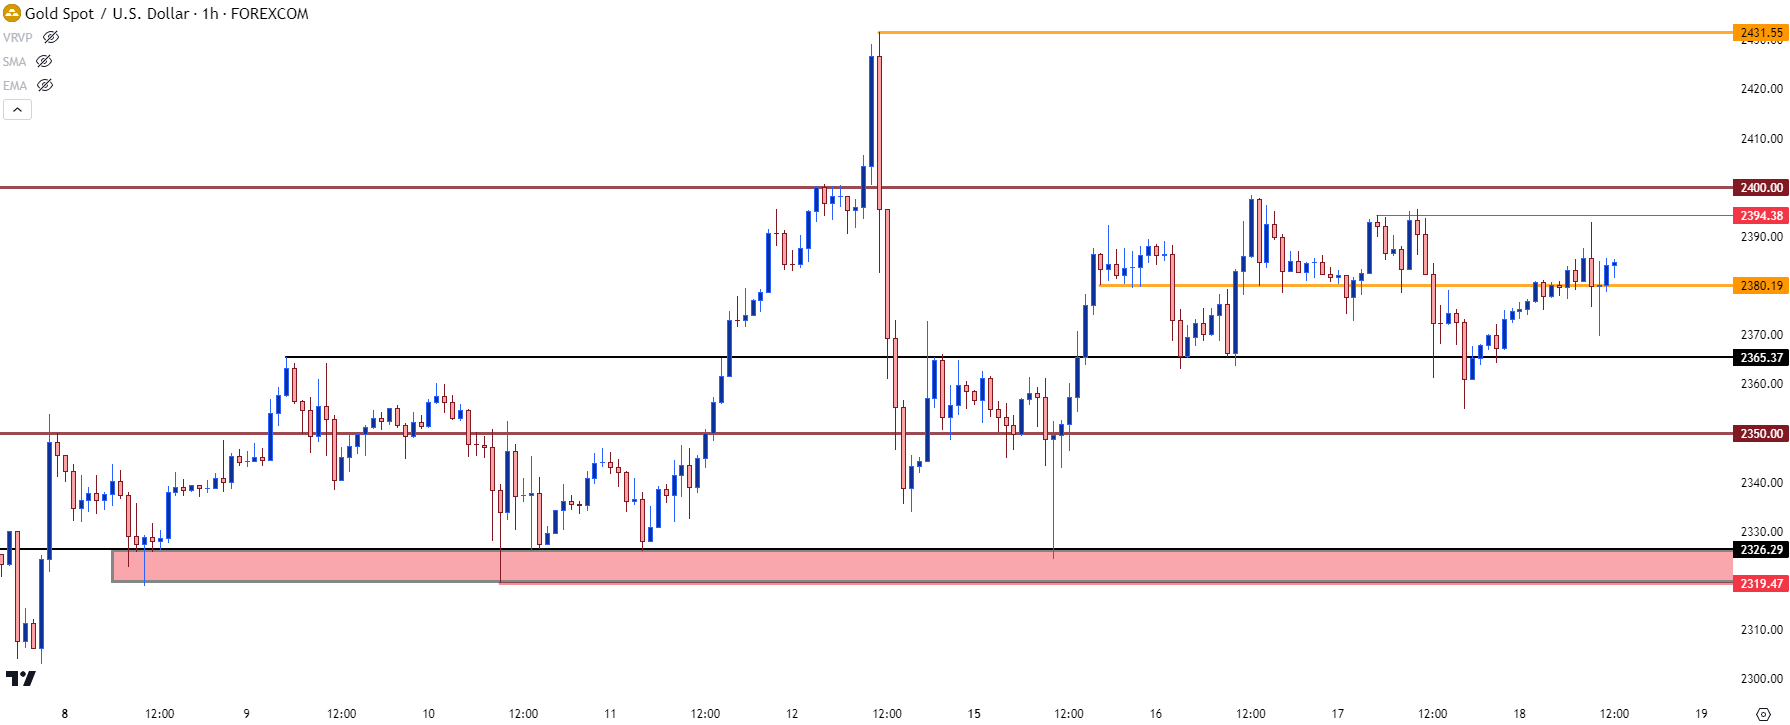 Chart prepared by James Stanley, Gold on Tradingview
Gold Bulls Aren’t Dead Yet
At this point, the common deductive response to price stalling is that there may be a growing possibility of a pullback. And that can be argued from several vantage points. But that would also seem to be an early argument at this point on Gold as bulls have continued to bid support.
We saw a strong response on Monday as price reverted to the $2319-2326 zone, after which there was a show of support at $2365 and then another at $2380. A sell-off into the close yesterday has helped to bring bulls back into the mix, with another push up to $2390.
All this to say, Gold bulls have still been showing responses to support, so it would be too early to say that Gold has topped. It’s when those supports start getting taken out that the prospect of topping can take on more attraction.
Gold (XAU/USD) Four-Hour Price Chart
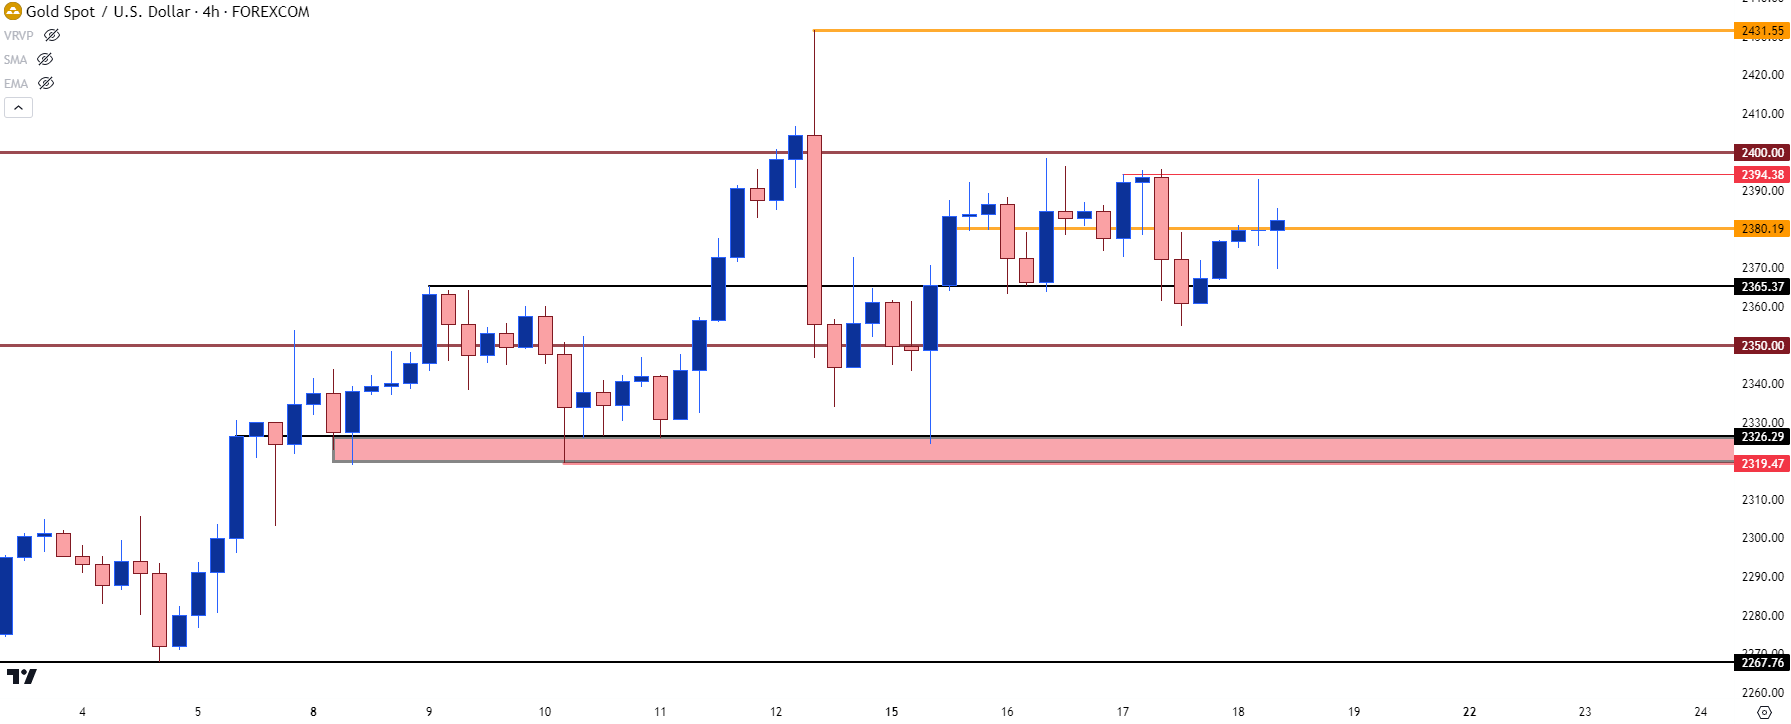 Chart prepared by James Stanley, Gold on Tradingview
Gold Bigger Picture: Historically Overbought
If we go out to the daily chart, we can start to get more perspective on the overbought situation in Gold. RSI on the daily chart flared all the way up to just under 85 for the second time since the March open. This is rare, as outside of those two recent instances, there were only 11 other separate scenarios that daily RSI has closed above 80 in Gold, going back to the 2009 open.
This is the mirror image of the situation that I had looked at in early-October of last year, when Gold was flashing historically oversold levels with Daily RSI closing below the 20-level. Spot Gold has now gained as much as 34.3% from that October low; but the big question now is overbought conditions, not oversold.
On the below daily chart I’ve highlighted each of the other nine occurrences of daily RSI closing above 80. And, as you can see, that doesn’t necessarily mean that it’s a trend-killer, although it can regularly produce stall as drawing fresh buyers into a market that’s run so far, so fast can be difficult. There are, of course, some reversals that showed in response to the overbought backdrop, and that’s where we can begin to use price action in attempt of gauging directional response.
Gold (XAU/USD) Daily Chart since 2009 open
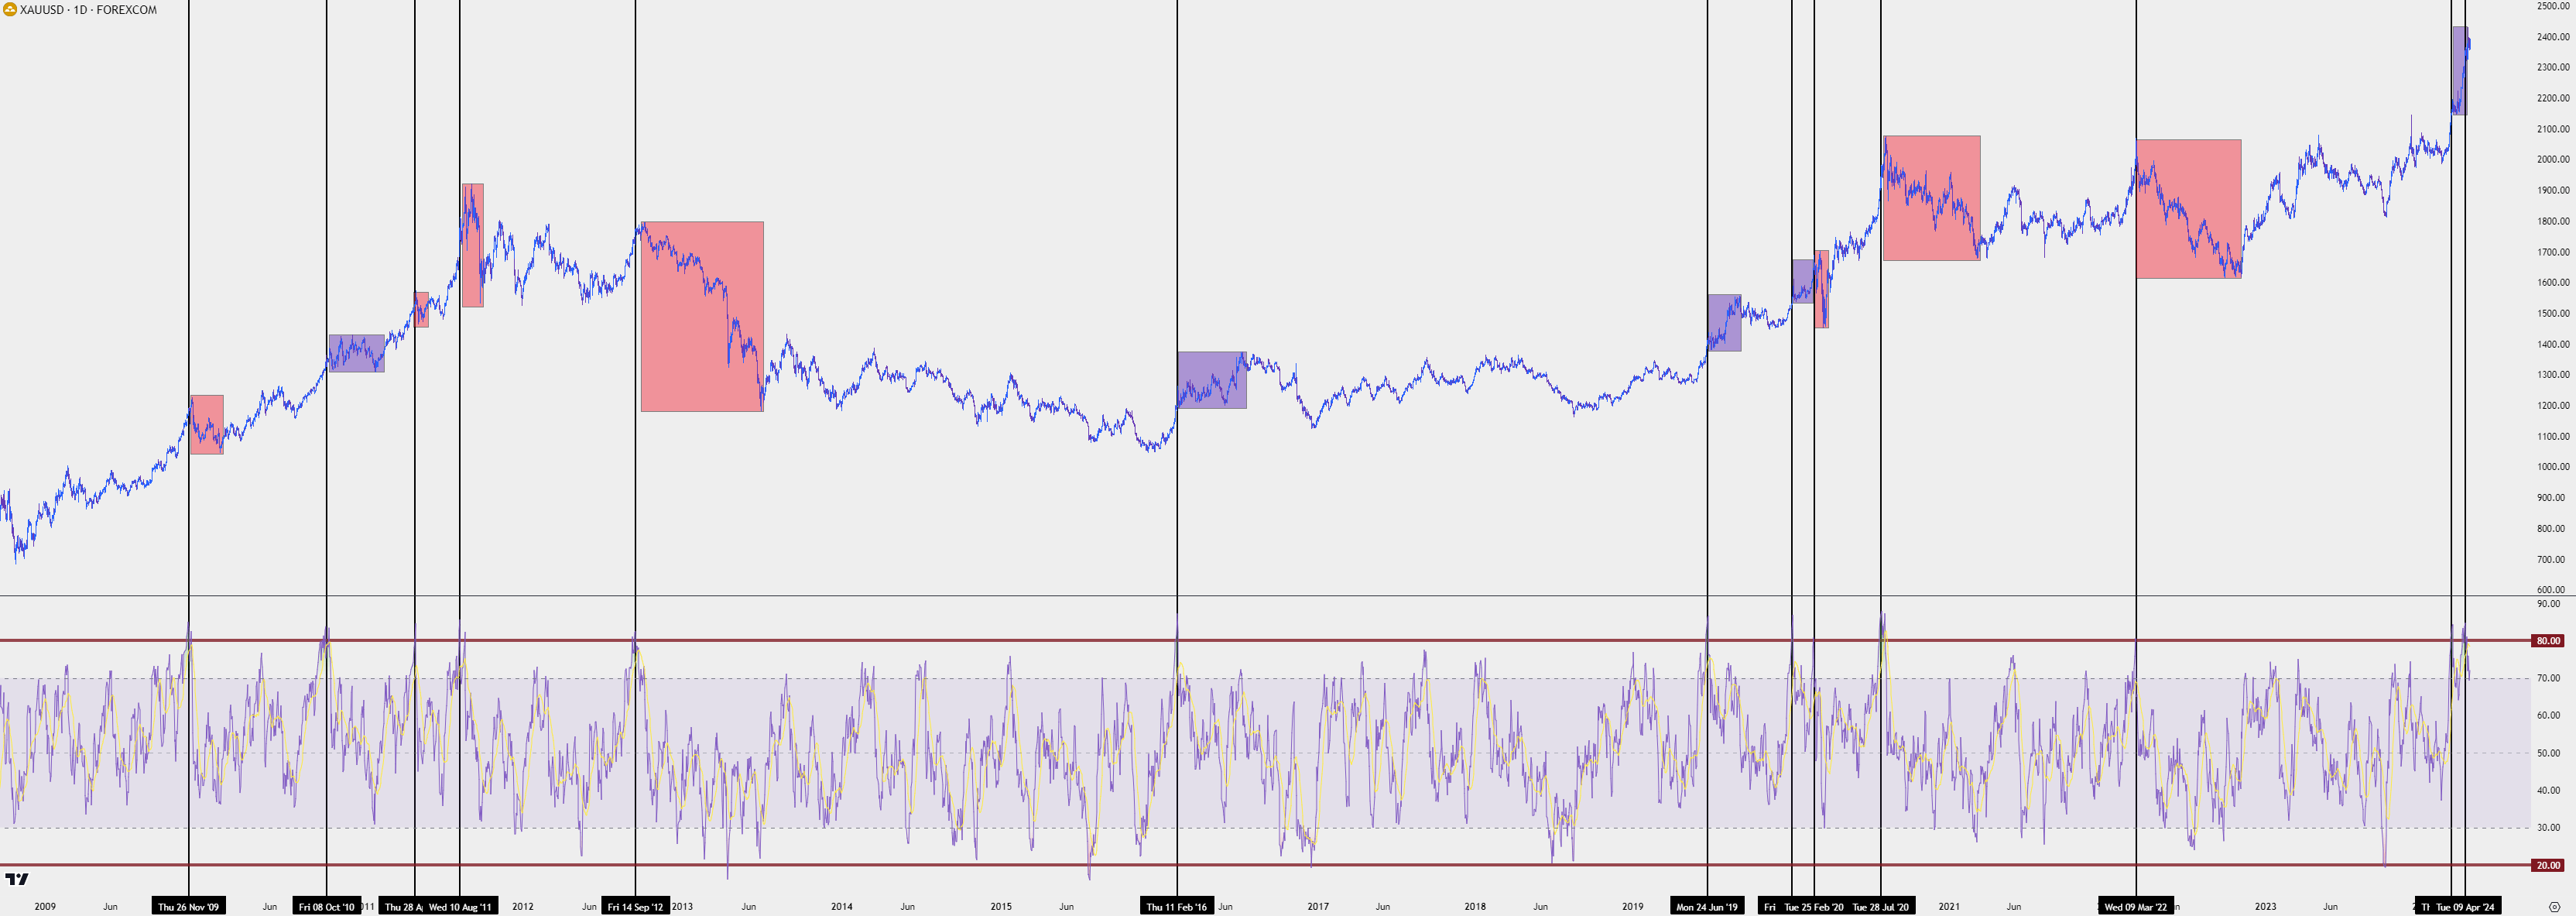 Chart prepared by James Stanley, Gold on Tradingview
Gold Weekly – Also Very Overbought
Extending that RSI discussion to include more scope, the weekly read of the indicator is fast approaching the 80-level, as well, and going back to the same 2009 open, there’s only been four other separate instances of such, and that’s had a more bearish appeal as there’s been multiple sell-offs that have shown afterwards, such as the swing high in 2020 before gold went into a range for the next few years, or the reading in 2010 as the gold market was topping from its post-GFC run.
Gold (XAU/USD) Weekly Chart
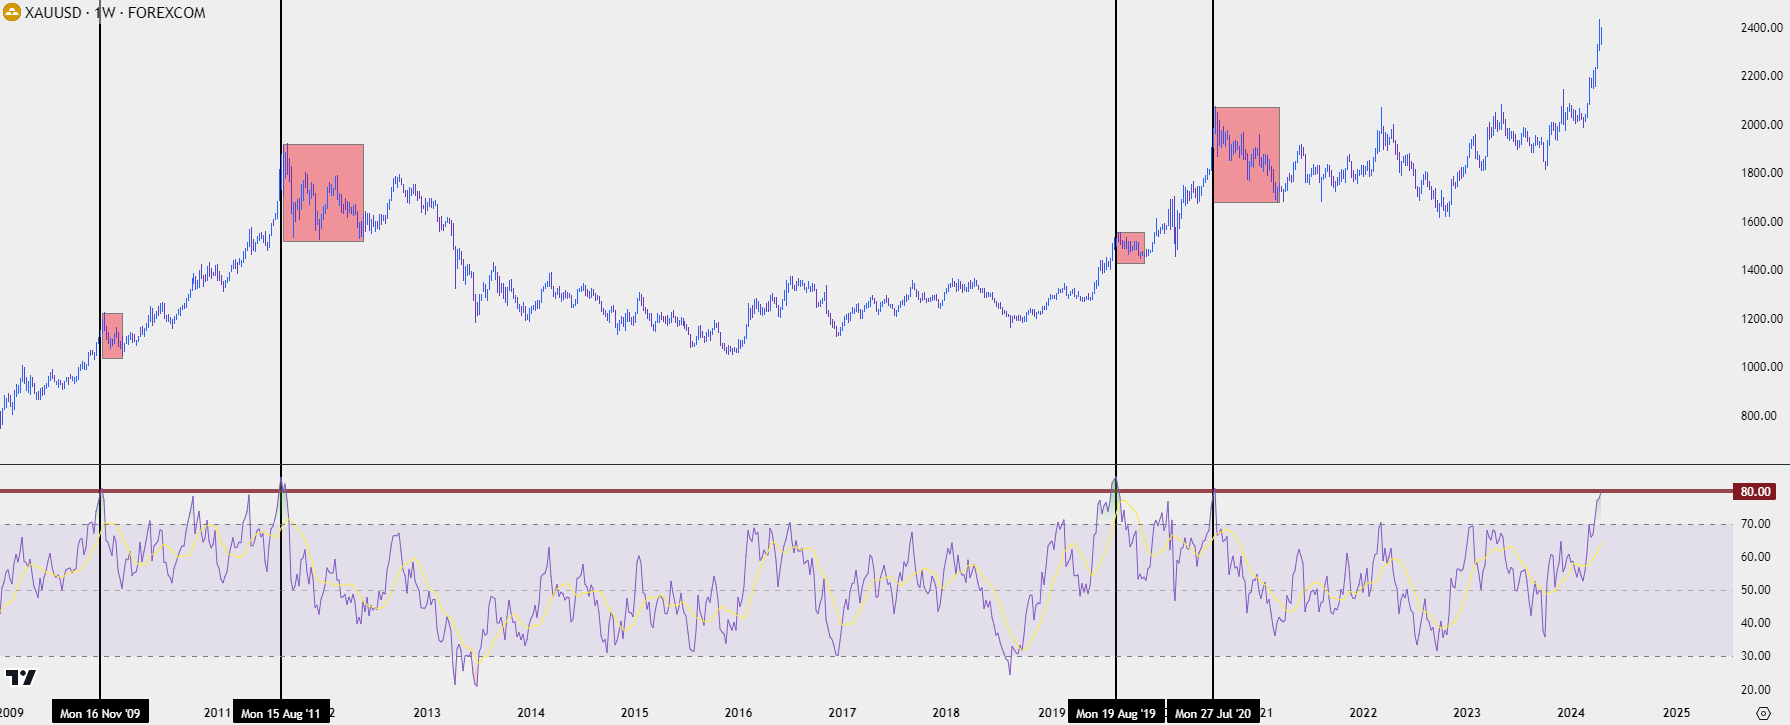 Chart prepared by James Stanley, Gold on Tradingview
So, Has Gold Topped?
It’s too early to say that for certain, but the stall that’s begun to show around the $2,400 level could be an early sign of such.
Now, this doesn’t mean that Gold is on the verge of a full-fledged reversal, as the answer to that problem will likely emanate from the fundamental side of the coin. And at this point, there’s several markets that have been stretched as the Fed has remained dovish and U.S. data has remained fairly strong.
At this point, from the daily chart, there’s simply potential for a deeper pullback given the fact that bulls haven’t been able to power through $2,400, and the shadow from the wick on the Friday candle looms ominously overhead. If sellers can start to breach supports at $2,350 and then through the key zone from $2319-$2326, that pullback scenario will start to take on more attraction, with focus then shifting to the $2267 level that set support twice in early-April, with the second instance on the morning of NFP.
If $2267 trades, then $2319-$2326 could be re-purposed as lower-high resistance potential, and that would expose deeper support around the $2167 level, that was resistance-turned-support form the early-December high to the March lows.
Longer-term, it remains of interest that the resistance zone that held the highs for more than three years still hasn’t seen much yet for support. That shows around the $2075-$2082 area of the chart.
Gold (XAU/USD) Daily Price Chart
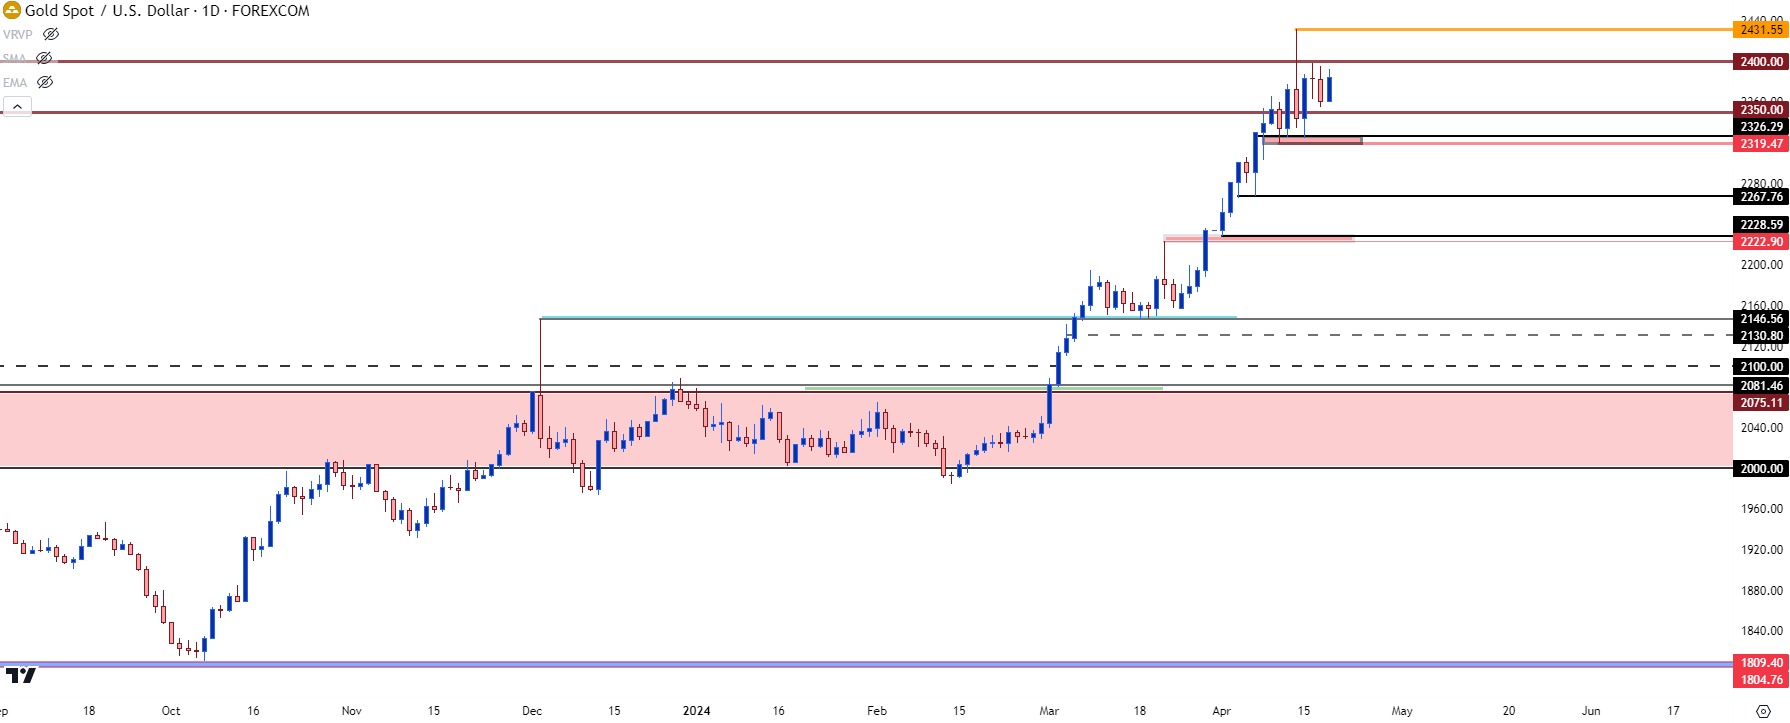 Chart prepared by James Stanley, Gold on Tradingview
The Gold Bullish Scenario
I shared those RSI charts earlier to help illustrate context and as I’ve already mentioned, a strong RSI read is certainly not a direct-driver of bearish scenarios.
But there is a nod towards market mechanics with such context, as one-sided trends can be prone to aggressive pullbacks, which can soon become their own bearish trends. It is very situation-specific, and should be approached as such.
The fact that bears haven’t yet been able to make a larger dent in this breakout is a factor that should be considered, along with the evidence from this week that buyers have continued to bid from support. So, we can’t definitively say that this has topped yet and in effort of building out that argument, we can look to what’s overhead to try to build an idea for how such a scenario may take place.
When Gold was breaking out aggressively in the summer of 2020, it was the $2,000 level that helped to stall the move. The same can be said in 2022 and again in 2023 as Gold continued to range. The $2,000 level is a major psychological level and a similar argument can be made for $2,500.
If Gold bulls can support the bid and keep prices from reversing, the next major level sitting overhead would be that psychological level at $2,500, and if it comes into play quickly, the same overbought argument from above could be applied. There’s a dearth of additional reference there given the fact that Gold is holding near ATHs, and as we’ve seen of late, Gold has started to see stall near round levels such as $2350 or $2400. If Gold bulls can press – and run up to $2500, there’s likely going to be a considerable number of longs looking to take profit, and that can produce the stall that can, potentially, lead into pullback scenarios.
Gold (XAU/USD) Weekly Price Chart
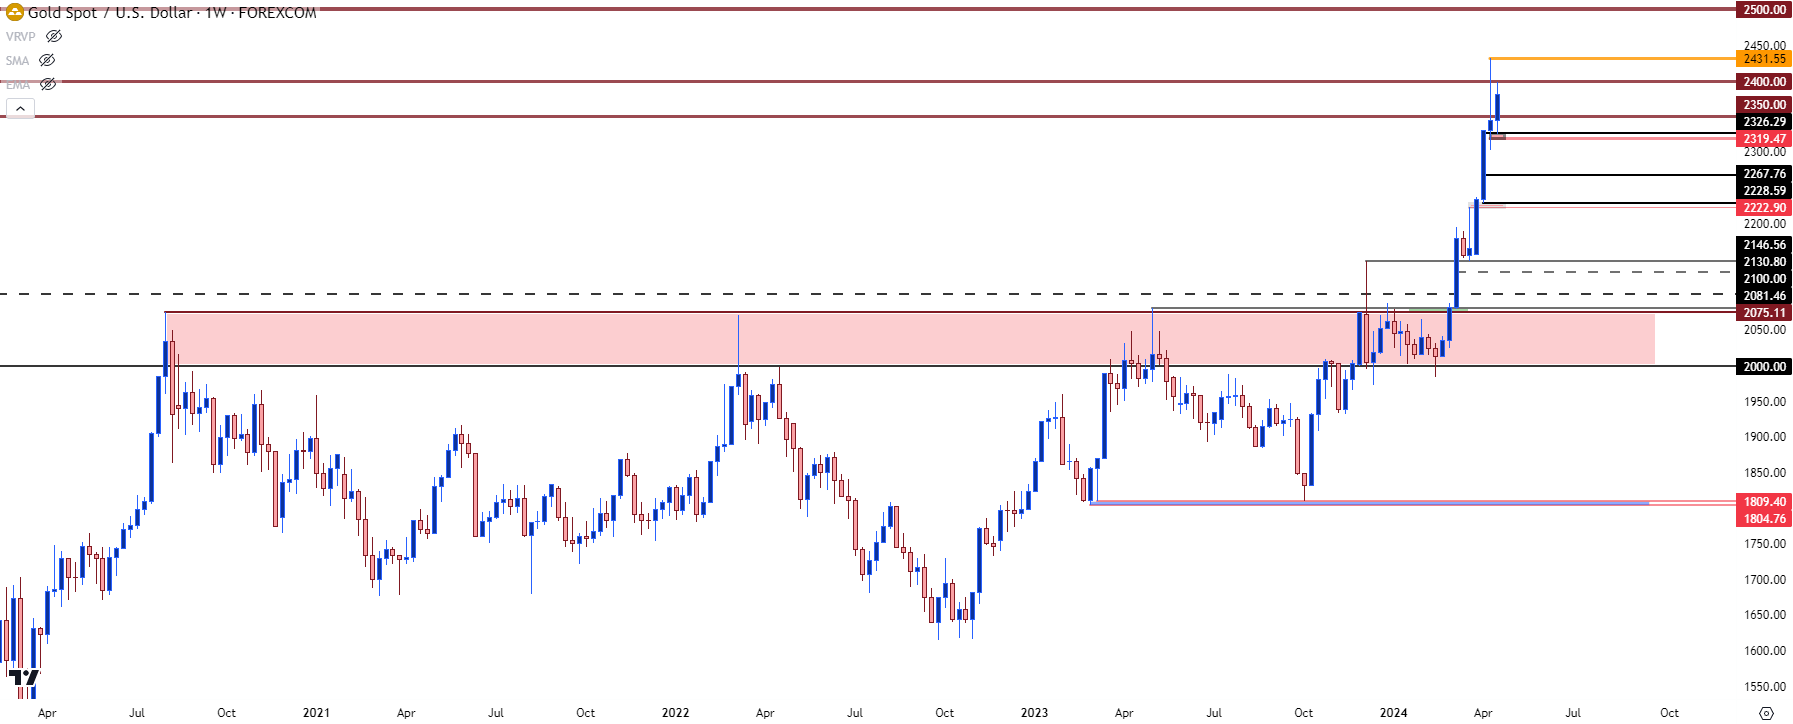 Chart prepared by James Stanley, Gold on Tradingview
--- written by James Stanley, Senior Strategist


