Gold Talking Points:
- Gold prices put in a massive breakout on Tuesday to set a fresh yearly high.
- Gold has since found resistance just inside of the $2,050 level on Wednesday and that’s led to a pullback on Thursday. Tomorrow brings the Non-farm Payrolls report on Good Friday, which means potential for holiday-thinned liquidity. Can Gold bulls hold the yellow metal above 2k to allow for only its second ever weekly close above the big figure?
- I’ll be discussing these themes in-depth in the weekly webinar on Tuesday at 1PM ET. It’s free for all to register: Click here to register.
Gold prices dominated the headlines in the early portion of this week as the Yellow metal showed a strong breakout beyond the $2,000/oz psychological level. While this wasn’t the first time that gold has traded above that price, there hasn’t been a lasting move yet, and this begs the question as to whether we’re seeing a longer-term range test of resistance, or whether bulls are putting in the prelude to what could develop into another fresh all-time-high.
And, from the charts, there could be a case to be made on either side of that argument.
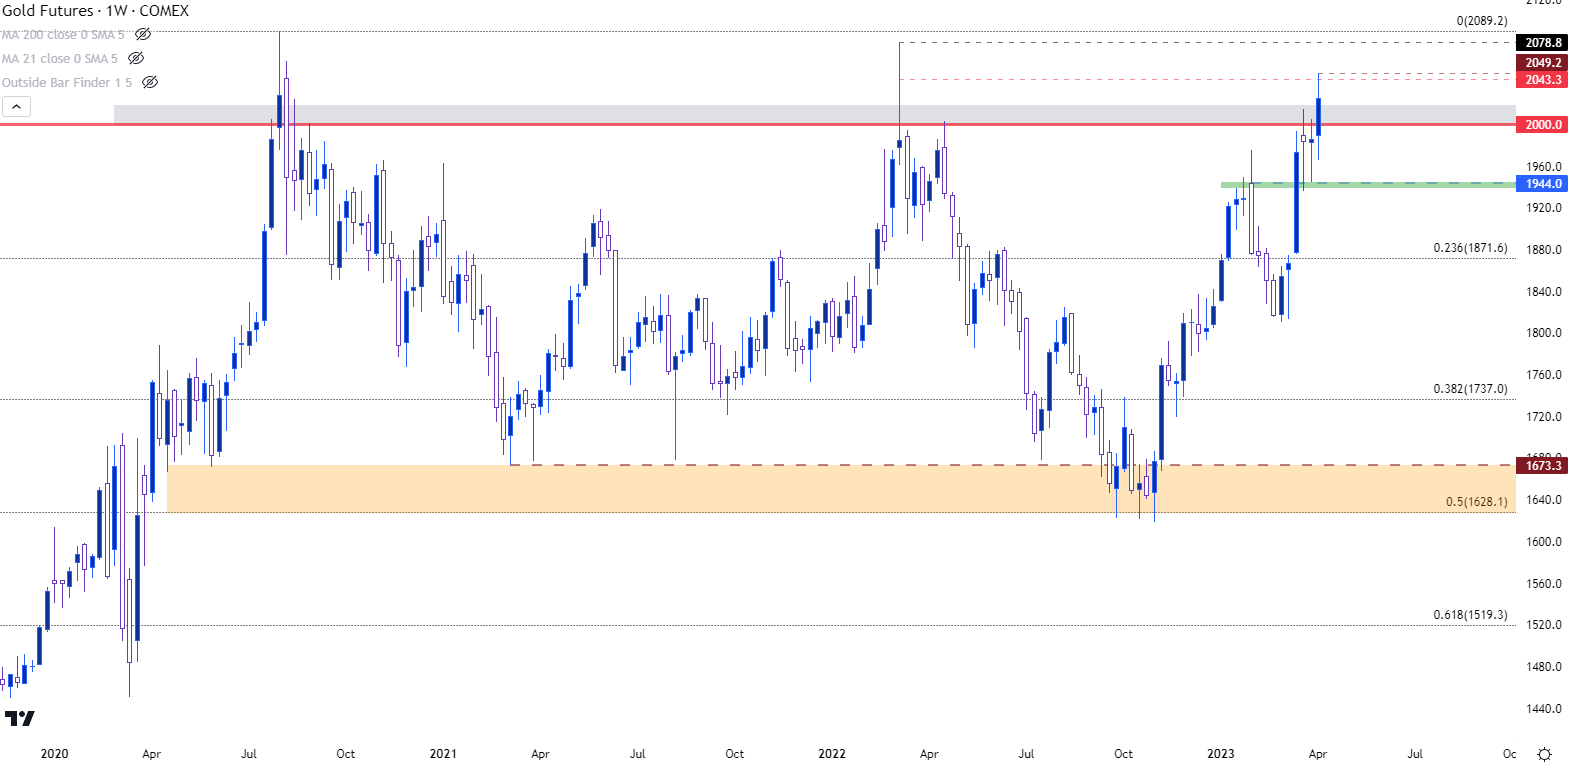
For the range perspective – we can look at the weekly chart which shows two prior tests above 2k, both of which have failed. The support side of the range appears around the 1628-1673 area.
Gold Weekly Price Chart
 Chart prepared by James Stanley, Gold on Tradingview
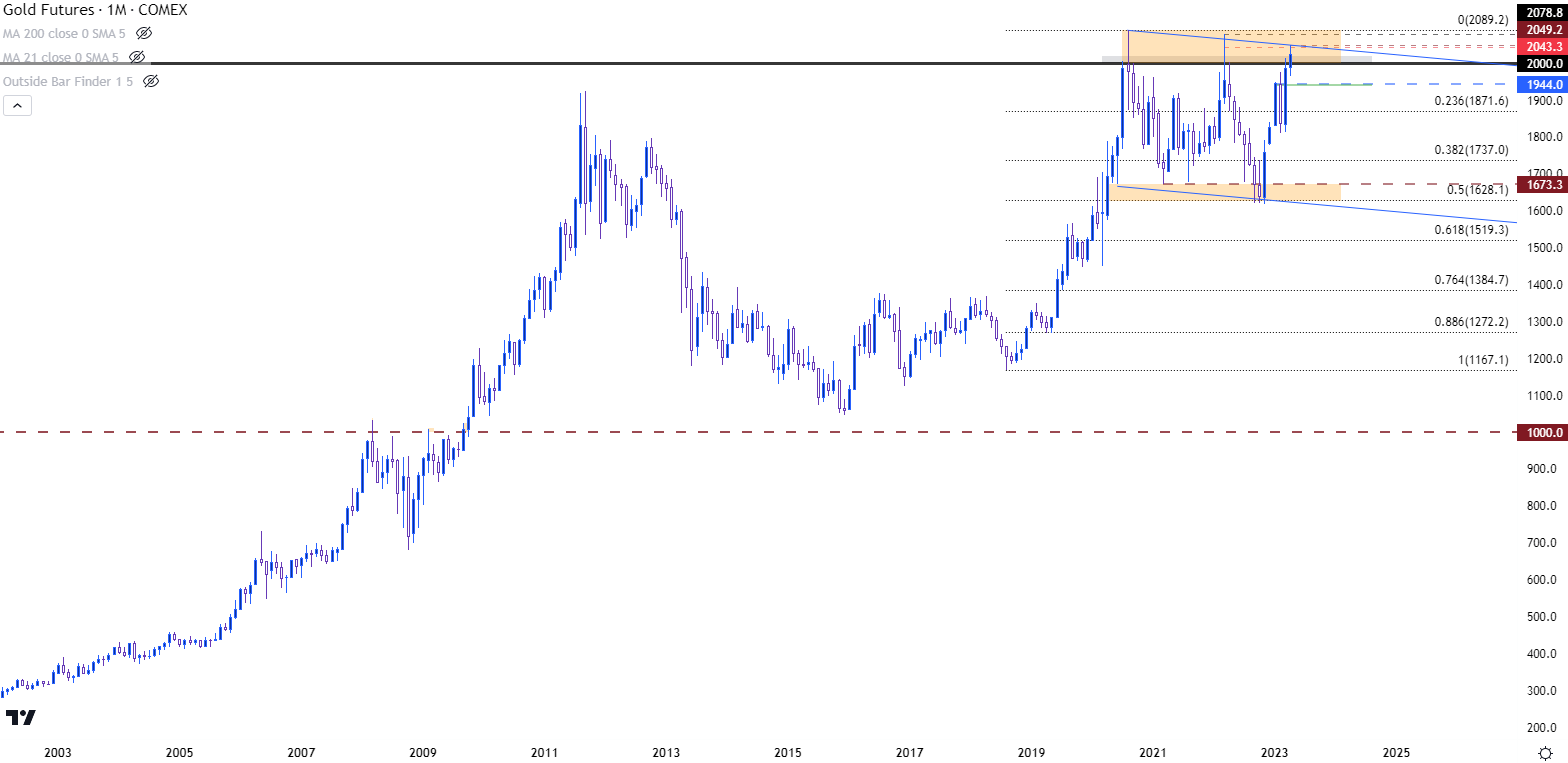
Taking a step back to the monthly chart highlights breakout potential, essentially taking the longer-term trend into account to add some context to the current range. The bullish trend in 2011 stopped short of the 2k level, but the bullish trend in 2020 was able to test above this price for the first time ever.
And then in 2022, the second test came into play, which was met with a lower-high and another failure to hold above $2,000/oz. The third test began two weeks ago – and that level held the highs for the past two weekly bars but the response showed on Tuesday of this week opened the door to breakout continuation potential.
Gold Monthly Price Chart

Chart prepared by James Stanley, Gold on Tradingview
Has Gold Topped – or Only Just Begun the Breakout?
I looked into this matter on Tuesday, trying to tie the argument back to the fundamental side of the equation and in doing so, attempted to use a comparison to the $1,000/oz psychological level which started to come into play during the financial collapse.
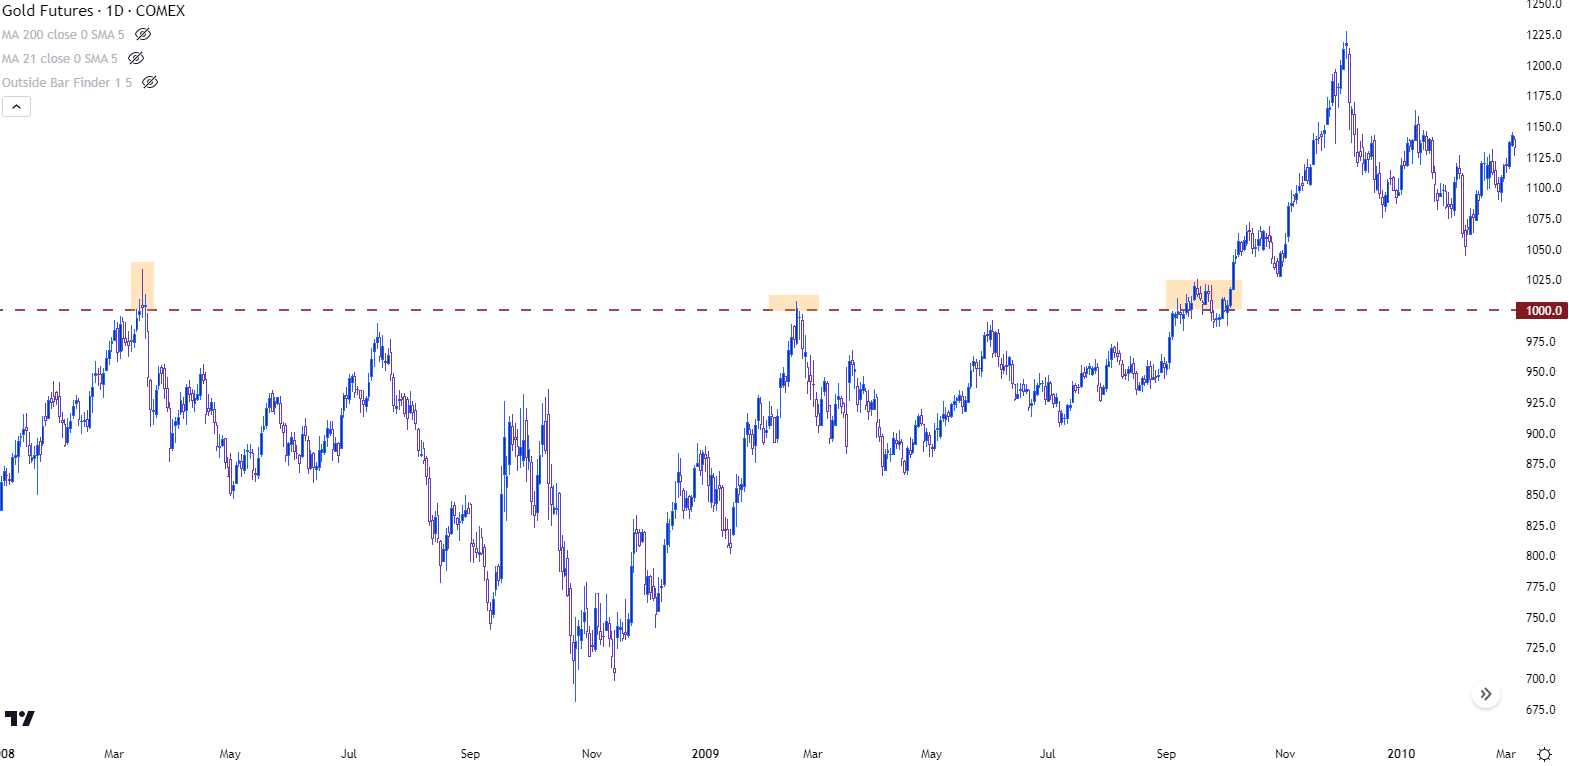
In March of 2008, the $1,000/oz level was tested for the first time ever and after two daily closes above, prices retraced as much as 34.13% from the highs until prices bottomed in October of that year.
A second attempt to breakout also failed in February of 2009, and it wasn’t until September of that year or a full 18 months after the initial test, that gold was finally able to leave the $1,000/oz level behind and it hasn’t been tested since.
Gold Daily Price Chart (2008 – March 2010)
 Chart prepared by James Stanley, Gold on Tradingview
Gold Strategy – Drawing Comparisons
The driving factor of that previous breakout in Gold from the 1k level was FOMC stimulus helping to drive bond yields lower, which then created more motivation for investors to take on exposure in non-interest-bearing assets, such as gold. Because when cost of capital is low, incentive to speculate is high, by design, and when there’s the prospect of currency debasement entering the equation from printing more currency to buy more bonds to further depress yields, there can be an attractive fundamental argument behind gold.
This is what was driving the trend through the 1k breakout in 2009 and for the next two years, until gold topped in 2011. And then again, in 2020, in response to covid as the Fed trotted out a bazooka of stimulus.
The question now is whether we’re in a similar spot from a macro-economic standpoint, and this is where the proverbial rubber meets the road. Rates markets, at this point, are pricing in multiple cuts from the Fed in the latter-half of this year. The Fed hasn’t said that this is something that they’re expecting and, if anything, multiple Fed members are directly saying that this is something that they are not anticipating. At the last FOMC rate decision, Jerome Powell even remarked that he was expecting ‘no cuts in 2023.’ Yet, rates markets have continued to price that in, and this has had impact on gold and a number of other markets.
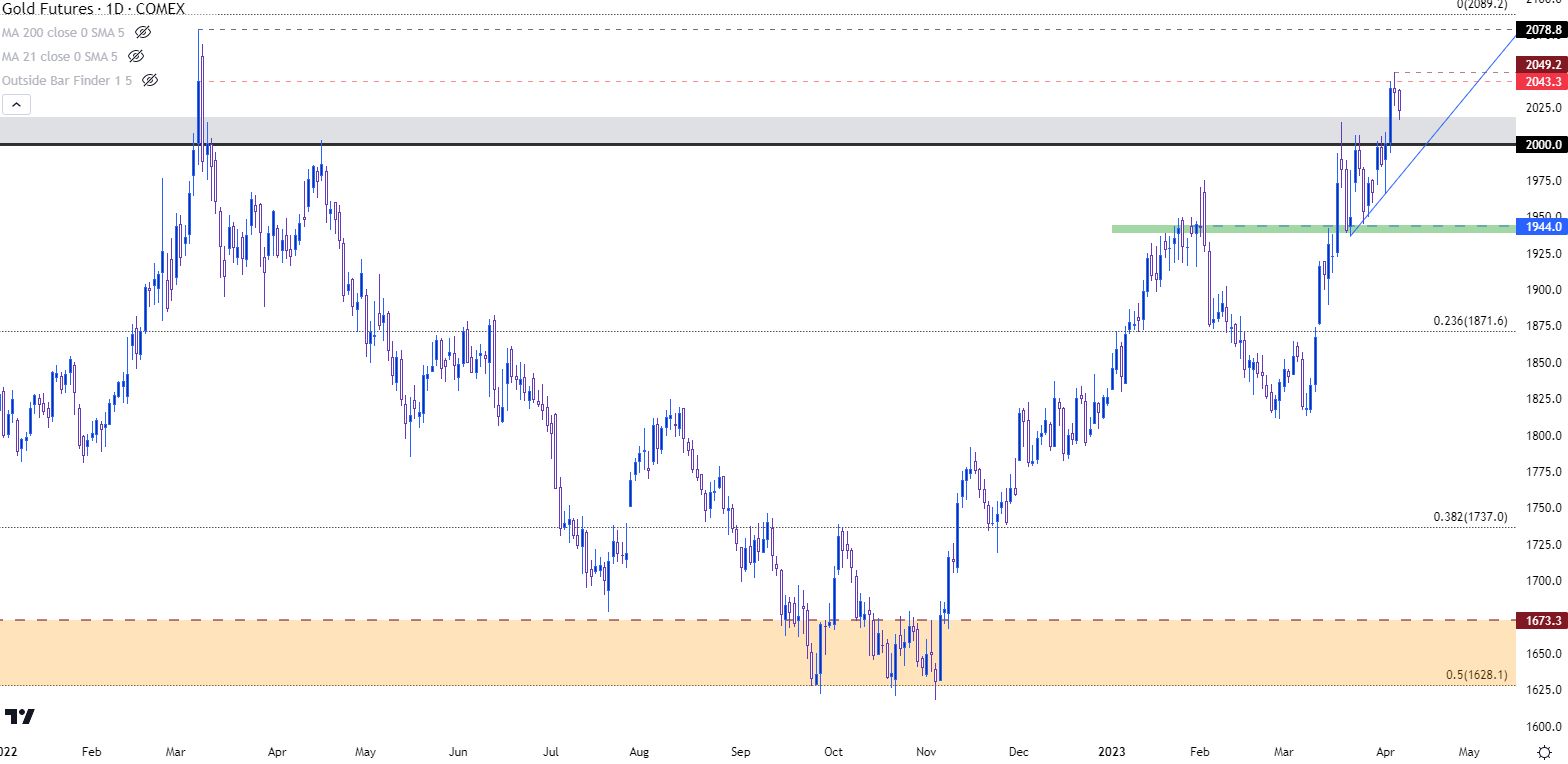
So from a fundamental perspective this can be difficult to justify. But the price action is undeniable and if gold can pullback to find support at the 2k level, the door would remain open for bullish trend continuation scenarios, largely on the basis of a higher-low support hold and support at prior resistance.
A weekly close below the $2k level, however, could bring on some different strategy potential that I’ll look at after the below chart
Gold Daily Chart
 Chart prepared by James Stanley, Gold on Tradingview
Gold closing below the 2k level for this week, particularly after such an effusive breakout showed earlier in the week, could be considered a failure from bulls. And that can keep the door open for swing potential along with mean-reversion aims, looking for range continuation of the same dynamic that’s been in-play for the past three years.
As to whether that develops into something more dramatic, such as the response to failed breaks at 2k in 2020 or 2022 will likely be determined by how rates markets price in expectations around the Fed. If the bank does move more towards the backdrop of all of the softening that’s expected, bulls can have a strong argument. But, if the Fed remains hawkish with aim of continuing to press inflation, that bullish argument can be difficult to justify from a fundamental point of view.
Gold Weekly Chart

Chart prepared by James Stanley, Gold on Tradingview
--- written by James Stanley, Senior Strategist
Follow James on Twitter @JStanleyFX


