Gold Price Outlook
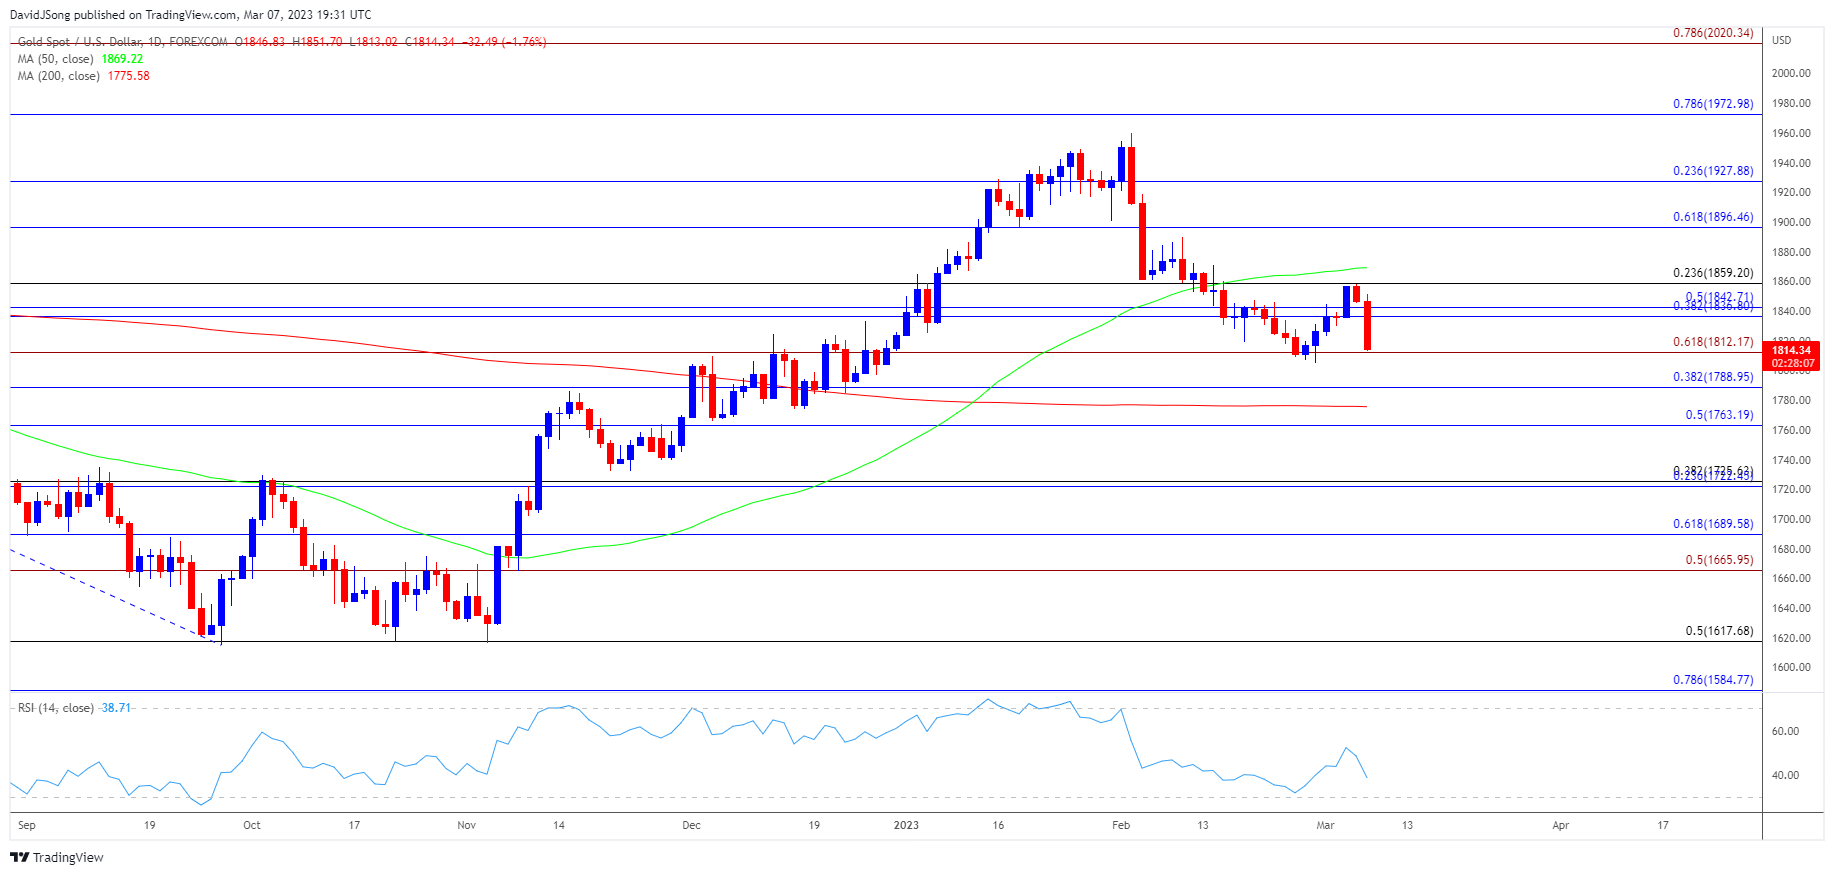
The price of gold appears to be reversing ahead of the 50-Day SMA ($1870) as it initiates a series of lower highs and lows, and bullion may continue to give back the rebound from the February low ($1805) as it fails to defend the opening range for March.
Gold price fails to defend March opening range
It seems as though the price of gold will no longer track the positive slope in the moving average as it fails to trade back above the moving average, and the precious metal may continue to trade to fresh monthly lows as recent remarks from Federal Reserve Chairman Jerome Powell fuels speculation for higher US interest rates.
During the semi-annual testimony in front of Congress, Chairman Powell warned that ‘ongoing increases in the target range for the federal funds rate will be appropriate,’ with the prepared remarks going onto say that ‘the latest economic data have come in stronger than expected, which suggests that the ultimate level of interest rates is likely to be higher than previously anticipated.’
Register here for the next Live Economic Coverage event with David Song

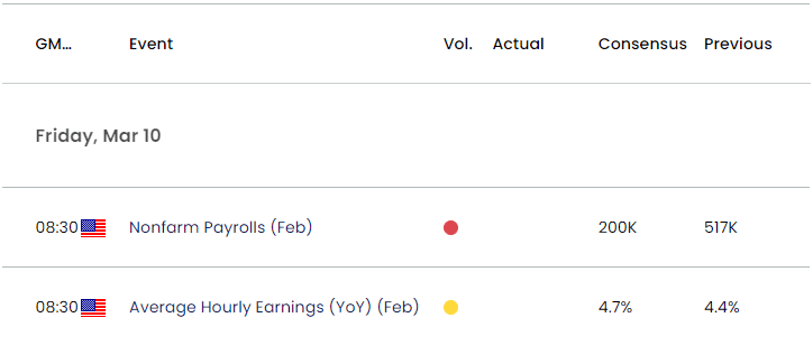
As a result, the upcoming update to the US Non-Farm Payrolls (NFP) report may keep the Federal Open Market Committee (FOMC) on track to implement additional rate hikes as the economy is projected to add 200K jobs in February. A positive development may sap the appeal of gold as it puts pressure on the Fed to extend the hiking-cycle, and it remains to be seen if Chairman Powell and Co. will project a steeper path for US interest rates as the central bank is slated to update the Summary of Economic Projections (SEP).
With that said, the price of gold may face headwinds ahead of the Fed rate decision on March 22 as market participants brace for a more restrictive policy, and bullion may continue to give back the rebound from the February low ($1805) as it fails to defend the opening range for March.
Gold Price Chart – XAU/USD Daily

Chart Prepared by David Song, Strategist; Gold Price on TradingView
- The price of gold registers a fresh monthly low ($1816) after struggling to push above $1859 (23.6% Fibonacci retracement), with a break/close below $1812 (61.8% Fibonacci extension) raising the scope for a test of the February low ($1805).
- Next area of interest comes in around $1789 (38.2% Fibonacci retracement), with a move below the 200-Day SMA ($1776) opening up the December low ($1766).
- However, the price of gold may trade within a defined range if it manages to hold above $1812 (61.8% Fibonacci extension), with a move above the 1837 (38.2% Fibonacci retracement) to $1843 (50% Fibonacci retracement) region raising the scope for a move towards $1859 (23.6% Fibonacci retracement).
--- Written by David Song, Strategist
Follow me on Twitter at @DavidJSong


