Gold Price Outlook
The price of gold trades in a defined range following the failed attempt to test the 2020 high ($2075), but fresh data prints coming out of the US may heighten the appeal of bullion should the developments fuel fears of a policy error.
Gold price defends weekly low going into Fed blackout period
The price of gold may trade sideways over the remainder of the month as it holds above the weekly low ($1969), and speculation surrounding major central banks may keep the precious metal afloat as market participants brace for a looming change in regime.
Join David Song for the Weekly Fundamental Market Outlook webinar. Register Here

Looking ahead, the update to the US Gross Domestic Product (GDP) report may sway gold prices as the economy is projected to grow 2.0% after expanding 2.6% during the last three months of 2022, and signs of slowing activity may put pressure on the Federal Reserve to alter the course for monetary policy especially as the core Personal Consumption Expenditure (PCE), the central bank’s preferred gauge for inflation, is also expected to narrow to 4.2% from 4.4% during the same period.

Source: CME
Evidence of easing price pressures may boost speculation for a U-turn in Fed policy as the CME FedWatch Tool reflects expectations for lower US interest rates ahead of 2024, and it remains to be seen if Chairman Jerome Powell and Co. will deliver another rate hike at the next interest rate decision on May 3 as the central bank acknowledges that ‘some additional policy firming may be appropriate to attain a sufficiently restrictive policy stance to return inflation to 2 percent over time.’
Until then, data prints coming out of the US may sway bullion as Fed officials enter the quiet period ahead of their next meeting, but the price of gold may face range bound conditions over the remainder of the month as it holds above the weekly low ($1969).
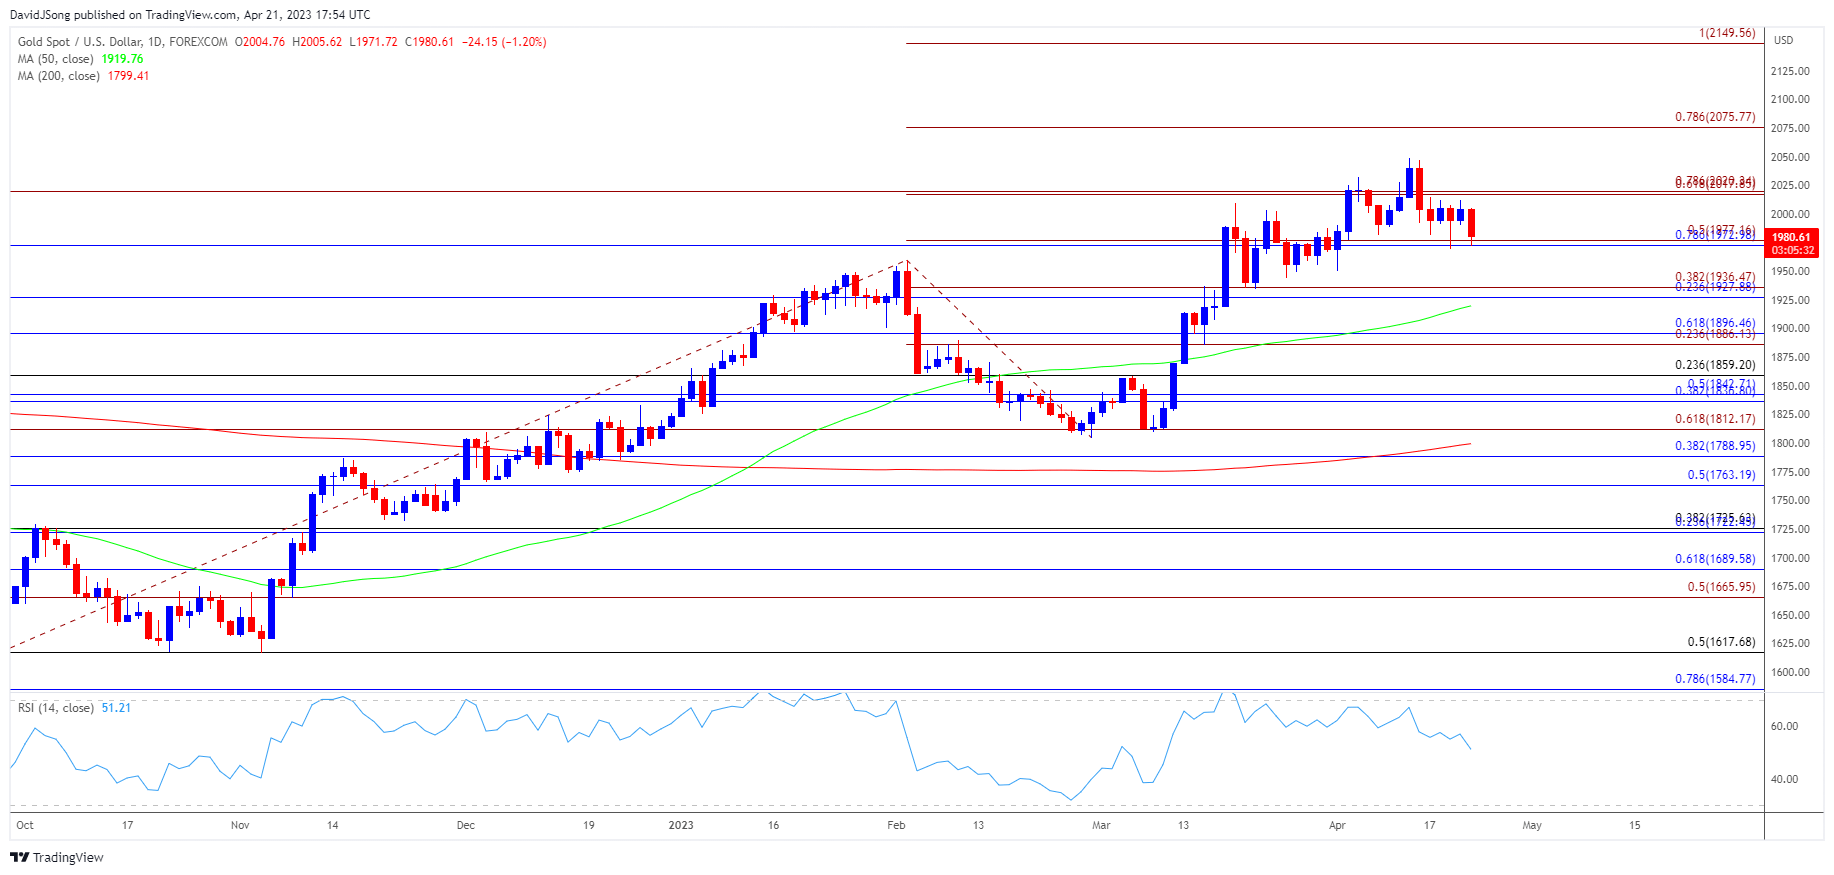
With that said, the price of gold may continue to consolidate following the failed attempt to test the failed attempt to test the 2020 high ($2075), but the precious metal may broadly track the positive slope in the 50-Day SMA ($1920) amid the threat of a policy error.
Gold Price Chart – XAU/USD Daily

Chart Prepared by David Song, Strategist; Gold Price on TradingView
- The price of gold appears to be stuck in a defined range after failing to test the 2020 high ($2075), and the exchange rate may continue to consolidate as it holds above the weekly low ($1969).
- Lack of momentum to close below the $1973 (78.6% Fibonacci retracement) to $1977 (50% Fibonacci extension) area may push the price of gold back towards the $2018 (61.8% Fibonacci extension) to $2020 (78.6% Fibonacci extension) region as the 50-Day SMA ($1920) reflects a positive slope, with a break above the monthly high ($2049) raising the scope for another run at $2075 (78.6% Fibonacci extension).
- However, a close below the $1973 (78.6% Fibonacci retracement) to $1977 (50% Fibonacci extension) area may lead to a test of the monthly low ($1950), with the next area of interest coming in around $1928 (23.6% Fibonacci retracement) to $1937 (38.2% Fibonacci extension).
--- Written by David Song, Strategist


