Gold Price Outlook: XAU/USD
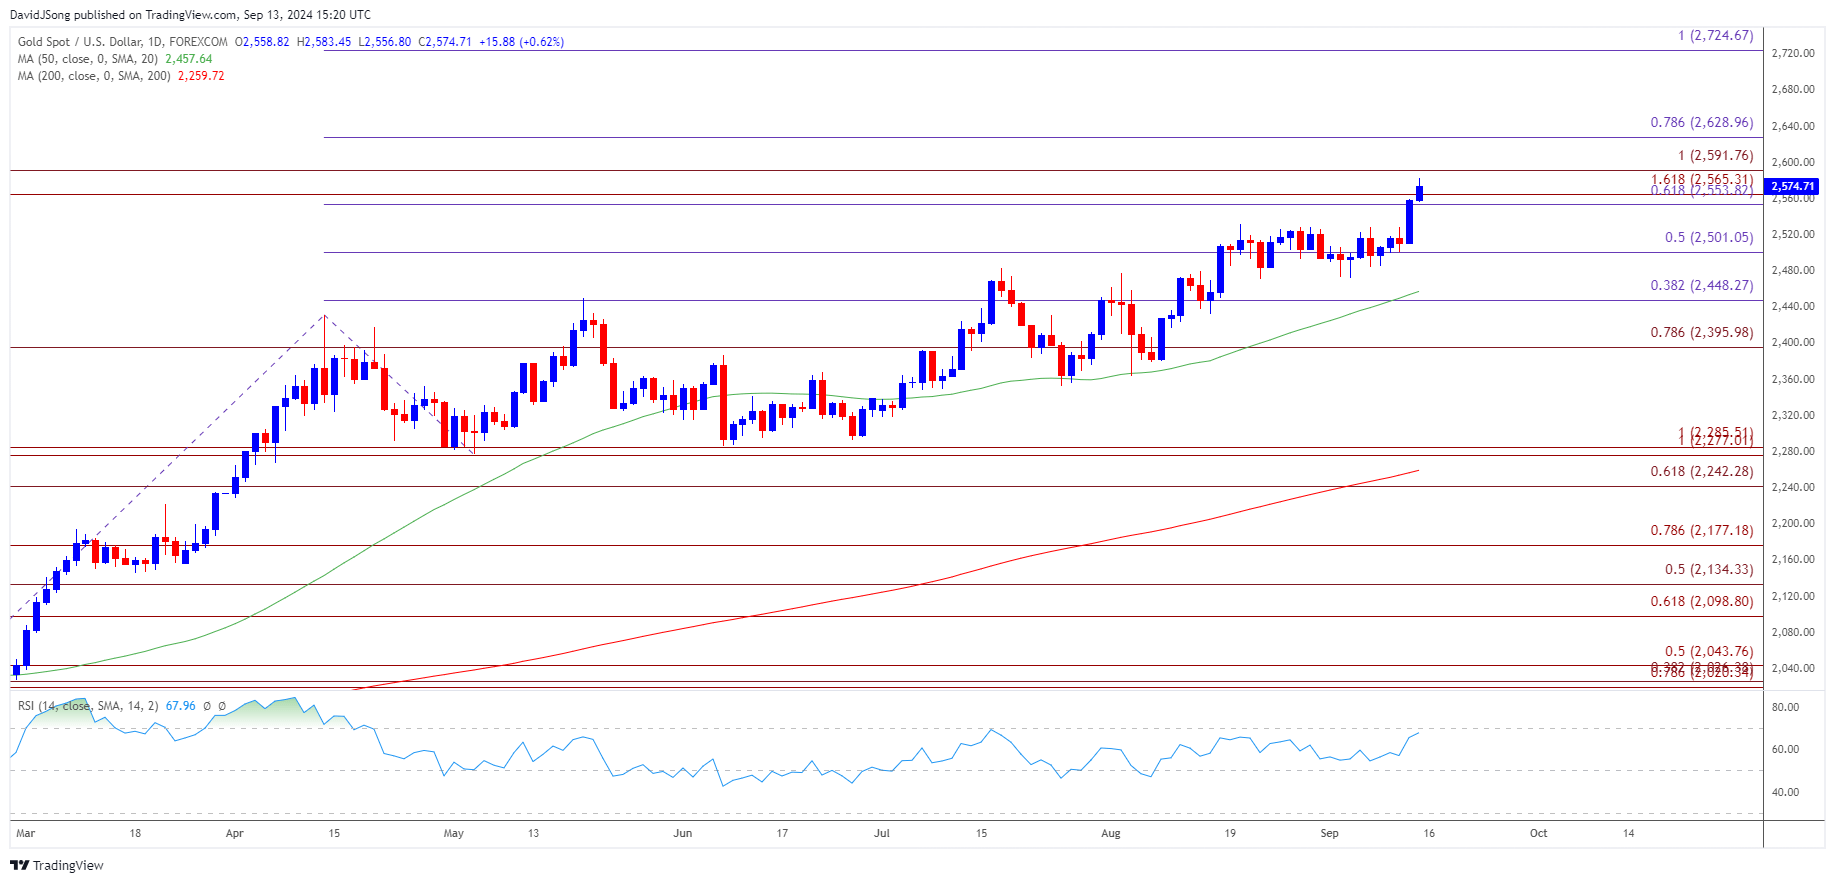
The price of gold hits a fresh record high ($2584) as it breaks out of last month’s range, with the recent strength in bullion pushing the Relative Strength Index (RSI) towards overbought territory.
Gold Price Breakout Pushes RSI Toward Overbought Zone
The rally in the price of gold may gather pace as the RSI climbs to its highest level since July, with a move above 70 in the oscillator likely to be accompanied by a further advance in bullion like the price action from the first half of 2024.
At the same time, the RSI may show the bullish momentum abating if it fails to push into overbought territory, and the price of gold may consolidate ahead of the Federal Reserve interest rate decision on September 18 if it struggles to extend the recent series of higher highs and lows.
Join David Song for the Weekly Fundamental Market Outlook webinar. David provides a market overview and takes questions in real-time. Register Here
Looking ahead, the fresh projections from Chairman Jerome Powell and Co. may reveal a lower trajectory for US interest rates compared to the Summary of Economic Projections (SEP) from the June meeting, and the threat of a policy error may keep the precious metal afloat as it offers an alternative to fiat-currencies.
With that said, the price of gold may continue to track the positive slope in the 50-Day SMA ($2458) as it holds above the moving average, but the precious metal may consolidate over the coming days if it struggles to extend the bullish price series from earlier this week.
XAU/USD Price Chart – Daily

Chart Prepared by David Song, Strategist; XAU/USD on TradingView
- The rally in the price of gold may persist as it breaks out of the range bound price action from last month, with a break/close above $2590 (100% Fibonacci extension) opening up $2630 (78.6% Fibonacci extension).
- Next area of interest comes in around $2730 (100% Fibonacci extension) but the price of gold may snap the recent series of higher highs and lows should it struggle to hold above the $2550 (61.8% Fibonacci extension) to $2570 (161.8% Fibonacci extension) region.
- Need a move below $2500 (50% Fibonacci extension) to bring the monthly low ($2472) on the radar, with next area of interest coming in around $2450 (38.2% Fibonacci extension).
Additional Market Outlooks
US Dollar Forecast: USD/JPY Rebounds Ahead of December Low
US Dollar Forecast: USD/CAD Pushes Above September Opening Range
EUR/USD Fails to Hold in September Opening Range Ahead of ECB
US Dollar Forecast: GBP/USD Susceptible to Bull-Flag Formation
--- Written by David Song, Strategist
Follow on Twitter at @DavidJSong


