US Dollar, Gold, EUR/USD, GBP/USD Talking Points:
- The US Dollar is in the midst of a sizable bearish move after the FOMC rate decision.
- While there were minimal expectations for a hawkish outlay or any pledges towards additional hikes, Powell and the FOMC were noticeably dovish in the statement and the response across markets has been aggressively risk-on with the US Dollar and Treasury yields showing a dramatic drop.
- EUR/USD and GBP/USD have been bid to go along with that USD-weakness, and this pushes the focus to rate decisions out of Europe and the UK tomorrow morning. Gold is showing a sizable bullish move and if we hear a similar chorus of dovishness from the ECB and BoE, that could further prod gold prices.
Jerome Powell has had a noticeable pattern of trying to attain balance at rate decisions this year, and given the backdrop, it makes sense as to why. Today showed little balance and to many market watchers, Powell came off as dovish as he’s been since this hiking cycle had begun. While Powell was not yet ready to pledge to rate cuts, the Fed did make a noticeable shift in the statement that made it seem as though they’re even more convinced that no additional hikes will be needed. And again, normally throughout this year there was a bit of give and take, where a dovish statement could be at least somewhat offset by a slightly hawkish press conference, but that’s not what took place today as the press conference drove an even stronger risk-on move across a number of assets.
Gold illustrates this dynamic well, with a strong bullish burst at 2:00 PM when the statement hit, driving XAU/USD back-above the $2,000 psychological level. And then another burst appeared around 2:30 with the start of the presser to push spot gold above the $2,020 level, and still driving-higher as of this writing.
Gold (XAU/USD) Five-Minute Price Chart
 Chart prepared by James Stanley, Gold on Tradingview
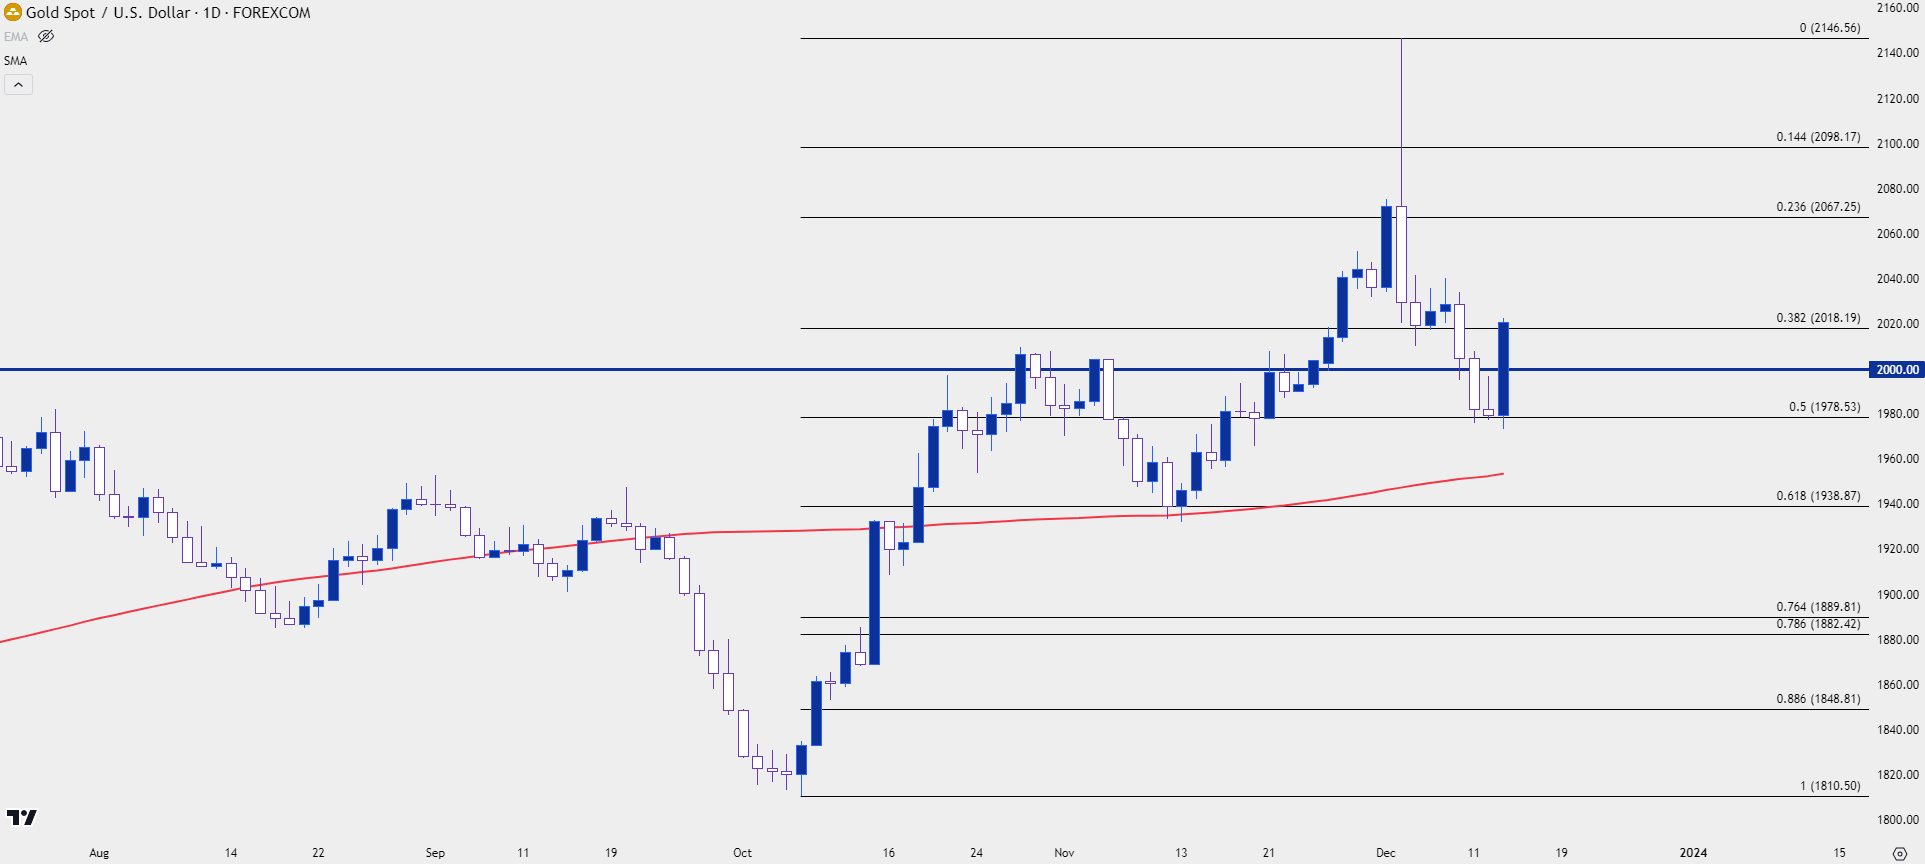
Putting some scope behind this move, we can look at the daily chart of Gold to see a strong move as driven by today’s rate decision. There’s a morning star formation that’s now brewing in Gold after the Tuesday bar held support at the same 50% Fibonacci level of 1978.
Gold (XAU/USD) Daily Price Chart
 Chart prepared by James Stanley, Gold on Tradingview
USD
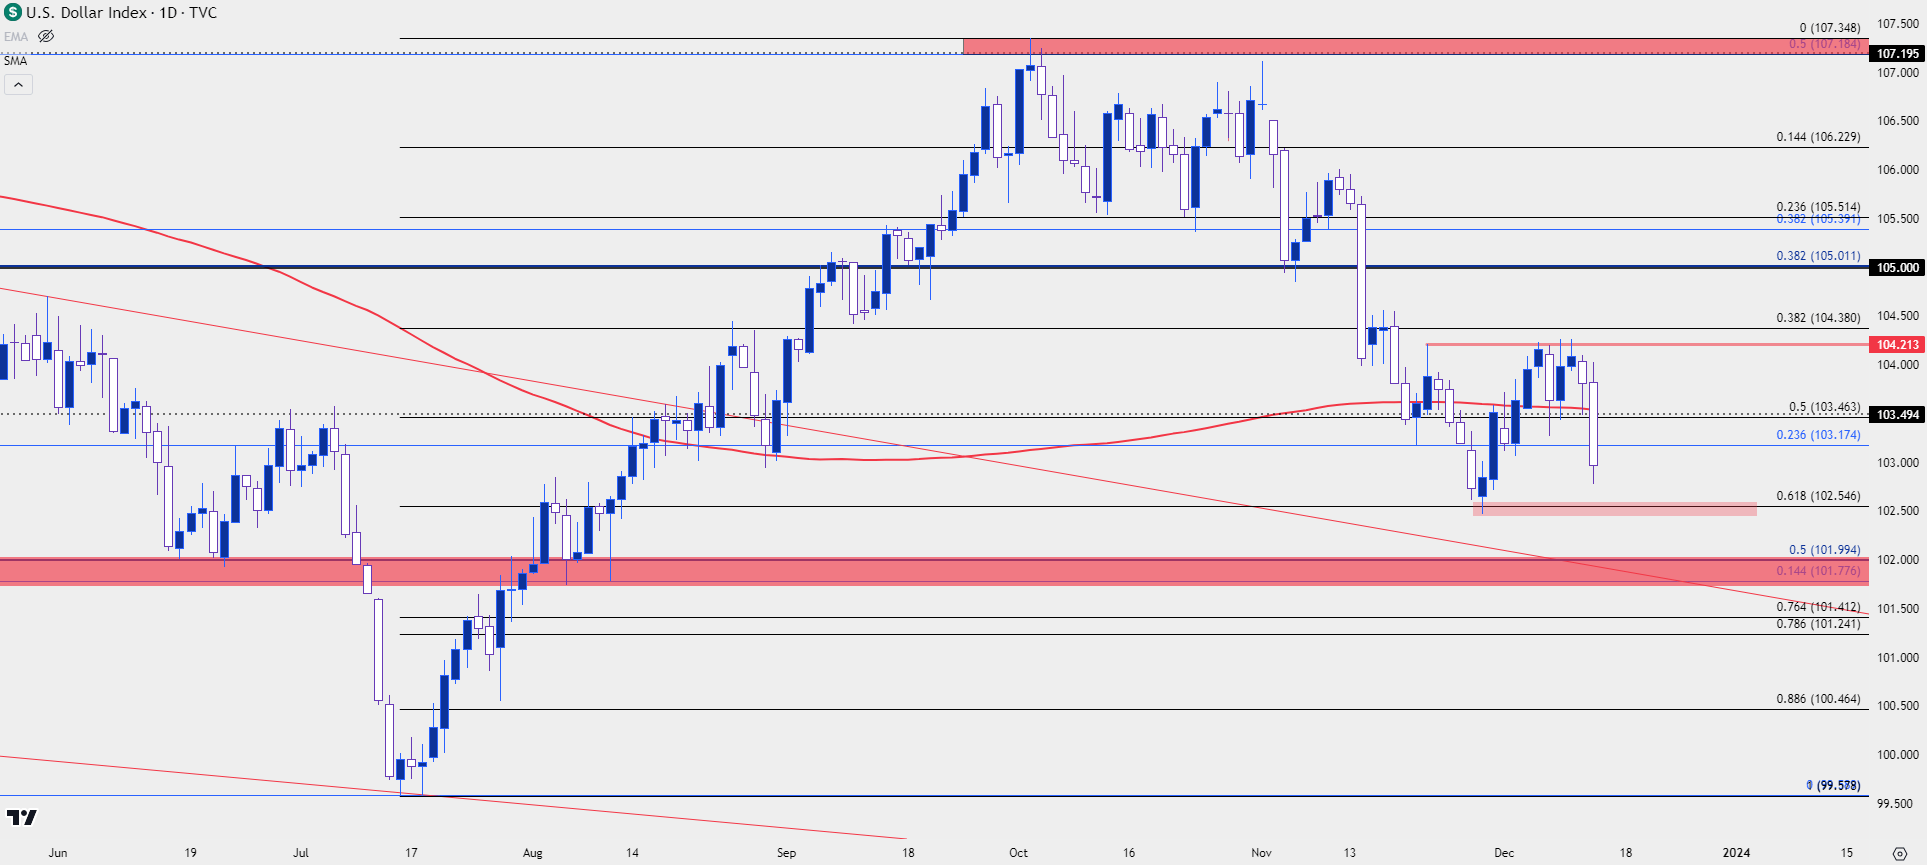
The US Dollar has snapped back after FOMC, and DXY is now trading at a fresh weekly low. This extends the theme that began to show in November and came along with bullish bursts in both EUR/USD and GBP/USD, along with that move in gold.
The DXY has pushed below that confluent batch of support at the 103.50 level and bears are making a fast run at the current four-month low that showed two weeks ago at the Fibonacci level around 102.50.
Below that is a confluent zone around the 102.00 handle. The big question as to whether that comes into play are the ECB and BoE rate decision on the cards for tomorrow.
US Dollar Daily Price Chart
 Chart prepared by James Stanley; data derived from Tradingview
EUR/USD
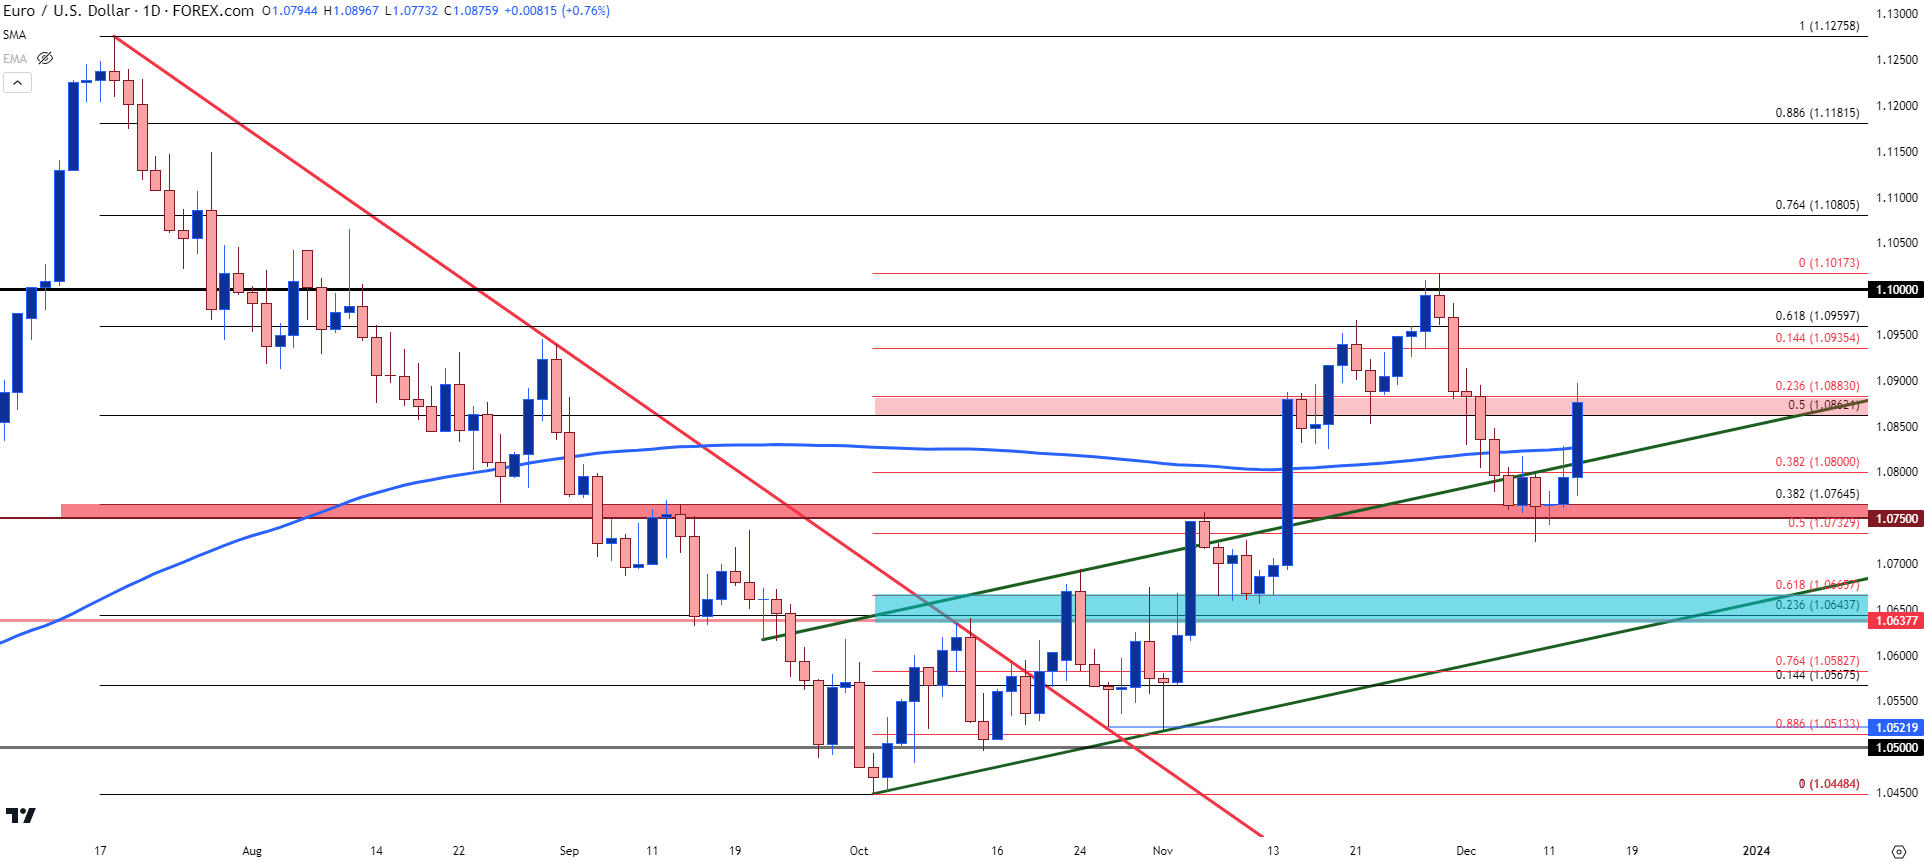
EUR/USD had put up quite the support hold in the 1.0750-1.0765 zone over the past week. It was an aggressive sell-off from the 1.1000 handle and sellers had faced a harsh rebuke on Tuesday at the 200 day moving average. But the corresponding pullback ultimately held support above the key zone and bulls have made another push this morning, extending up to the next resistance zone that runs from 1.0862-1.0883.
That spot has so far held the highs, but it does set up a higher-high, which could enable bulls to drive a bullish trend should they show up to hold higher-low support. There are a few different spots of interest for such, like the same 200 day moving average that was resistance yesterday and now plots around 1.0827. Or, perhaps the Fibonacci level at 1.0800 would be more appealing to bulls. But, given another rate decision on the cards for tomorrow morning the potential for continued volatility certainly exists.
EUR/USD Daily Price Chart
 Chart prepared by James Stanley, EUR/USD on Tradingview
GBP/USD Range Expansion
Before we get to the ECB tomorrow at 8:30 AM ET, we have a Bank of England rate decision scheduled for 7:00 AM. And similar to EUR/USD above, the pair has shown a bullish reaction to today’s FOMC and in GBP/USD, the move looks rather clean.
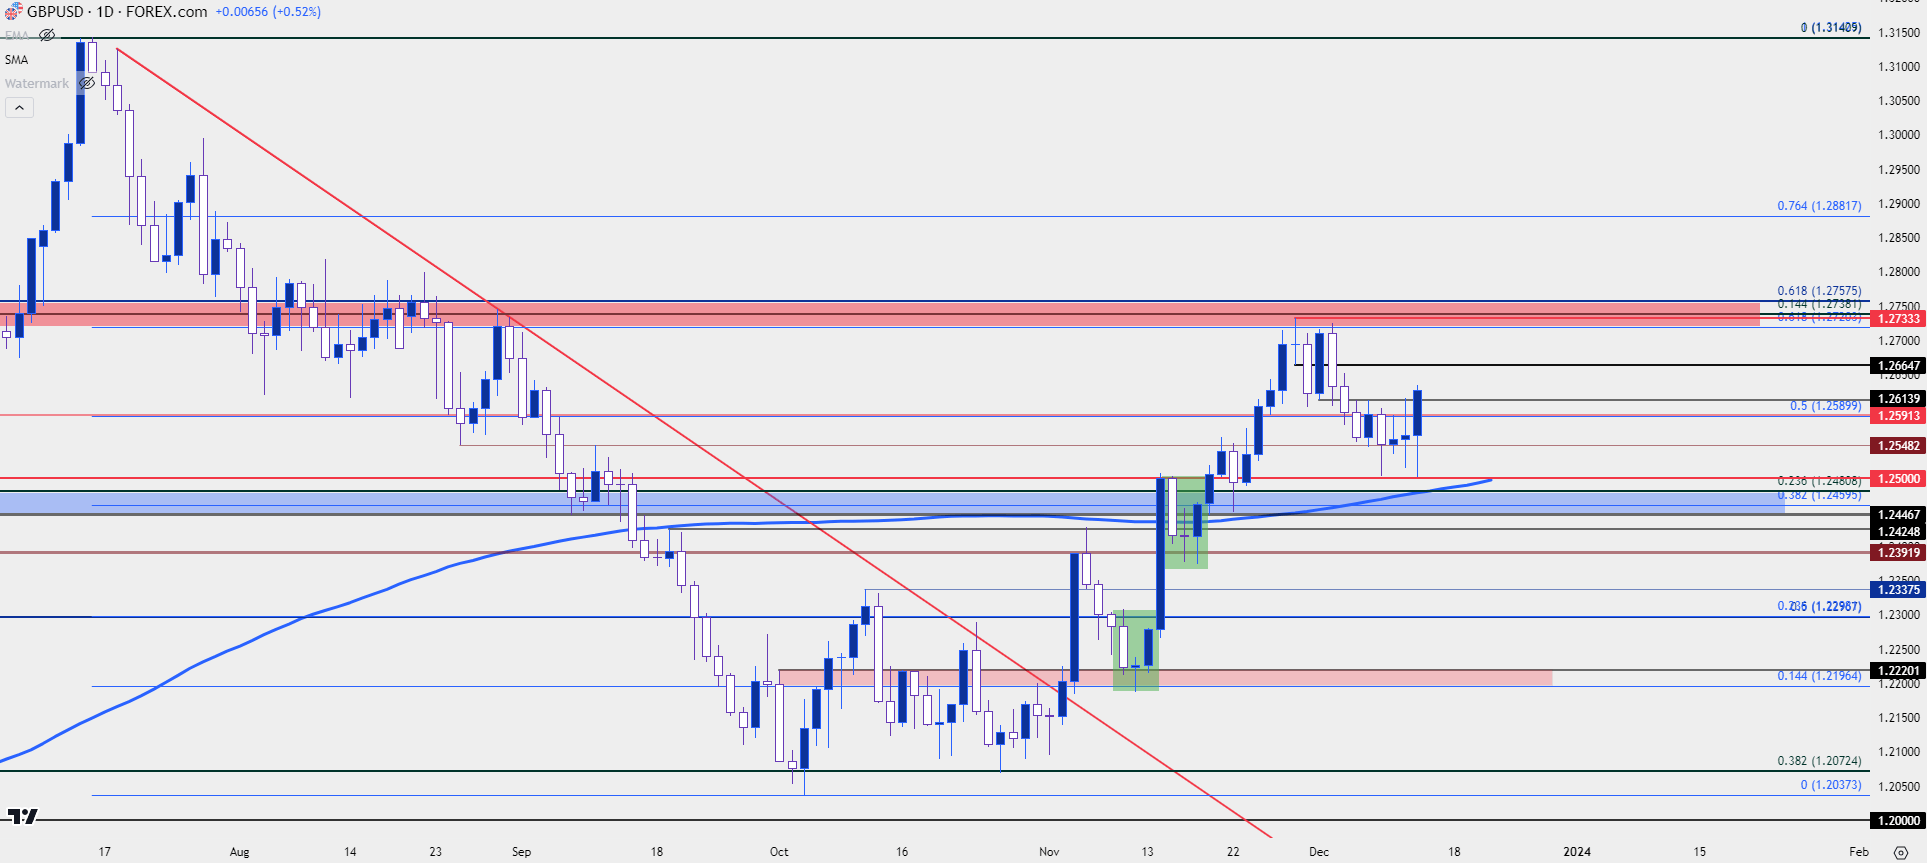
The 1.2500 psychological support was in-play earlier in the session, and this led to a push up to resistance at 1.2590, which had showed a tendency to hold bulls at bay over the past week. But there seems to be some renewed energy from buyers after today’s FOMC meeting and prices are now working on a bullish outside bar on the daily chart, along with a breach of recent resistance.
At this point there’s another resistance level that’s a little higher at 1.2665 before a major zone comes back into play and that’s around the 1.2720-1.2758 area, which has already held two resistance reactions so far over the past couple of weeks.
If the BoE comes off as less dovish than Powell and the Fed today, there could be fundamental scope for a continued push and that resistance zone becomes a focal point in that scenario.
GBP/USD Daily Price Chart
 Chart prepared by James Stanley, GBP/USD on Tradingview
--- written by James Stanley, Senior Strategist


