
US Dollar Talking Points:
- At the time of the webinar the USD was threatening a bullish breakout after a recovery move began to get priced-in last Thursday.
- That bullish bounce in the USD goes along with major points of resistance in EUR/USD and GBP/USD that have already driven sizable short-term moves.
- This is an archived webinar and you’re welcome to join the next installment: Click here to register.
At the start of this webinar there was a USD item setting up, as DXY was nearing a test of a key point of resistance. After last week’s webinar, bears were able to extend the move below 104.00, but they couldn’t hold it for long. The following day the USD pulled back after the ECB rate decision and this led to a bit of grind at the 104.25-104.38 zone that I’ve been tracking. Bulls have since pushed another higher-high, and given the construction on the below four-hour chart, there’s a possible inverse head and shoulders pattern in-play.
US Dollar Four-Hour Price Chart
 Chart prepared by James Stanley; data derived from Tradingview
USD Bigger Picture
The weekly chart remains notable as the USD has been range-bound for more than 18 months now. The current point of resistance is confluent with the 200-day moving average, and this happens after last week showed defense of Q2 support at the 104 level in DXY.
US Dollar Weekly Price Chart
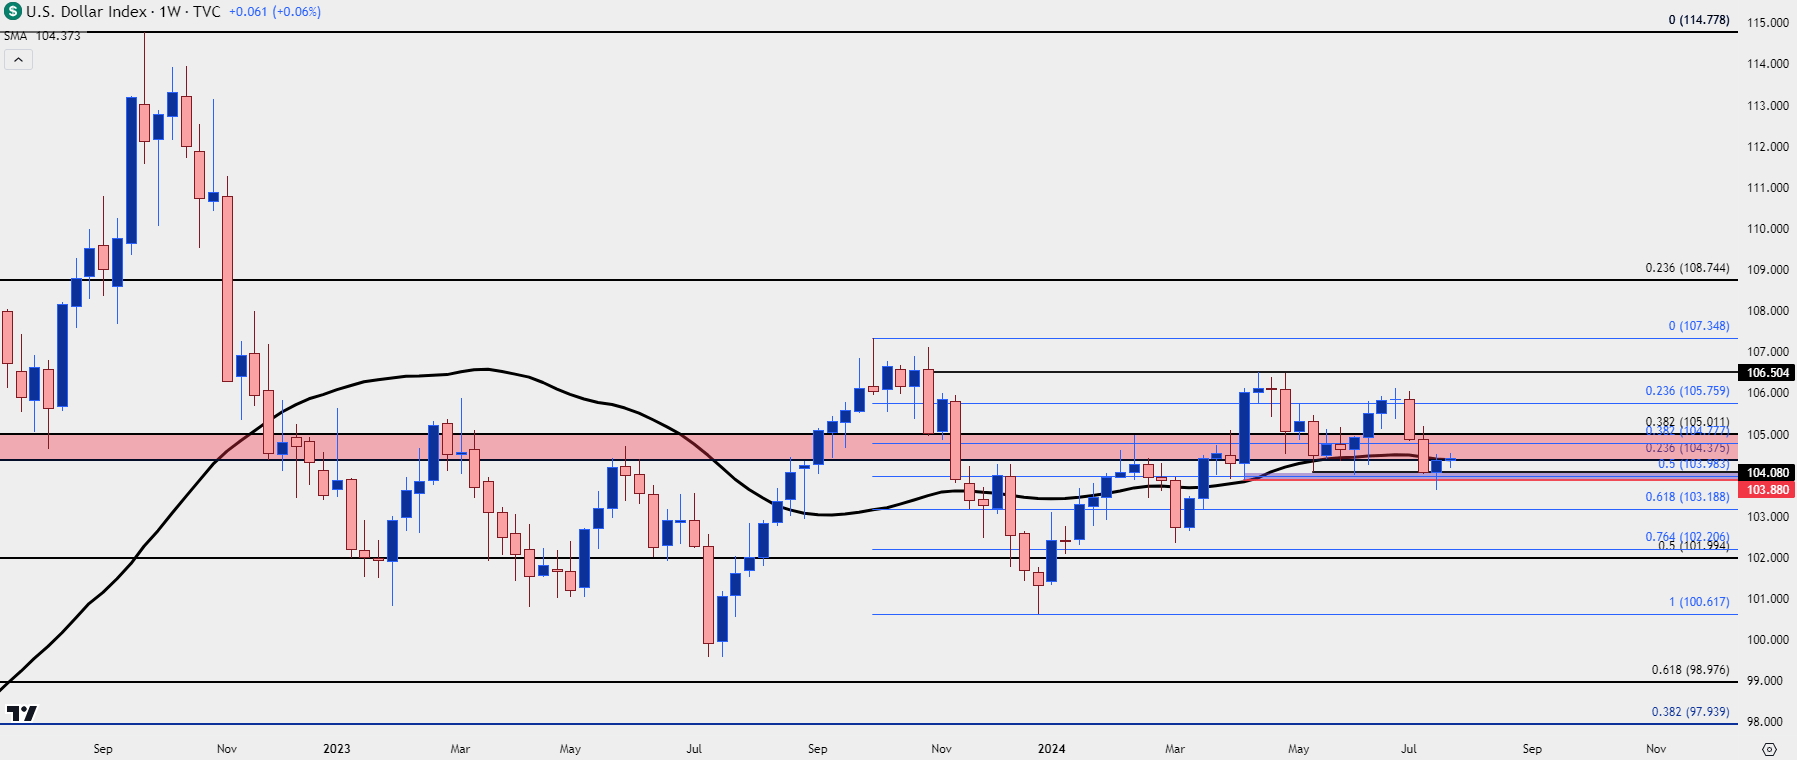 Chart prepared by James Stanley; data derived from Tradingview
Gold
Gold prices set a fresh all-time-high last week, but bulls shied away from a re-test at the $2,500 psychological level. As I had written around the time of last week’s high, these major psychological levels can play a big role in price action and we’ve seen that to a lesser degree with $2300 and $2400 in Q2.
But – from the weekly chart there’s a couple of notable items. First, adding context to a comment I made earlier in the webinar, while many often assume some type of inverse relationship between gold and the US Dollar, that doesn’t always should. On the below chart I’ve added a correlation coefficient with DXY and, as you can see, this waxes and wanes. Sometimes it’s close to perfectly inverse; others its close to directly correlated.
But, also worth mentioning is last week’s shooting star formation that printed after that fresh ATH. That type of candle will often be approached with aim of bearish reversal, possibly highlighting capitulation. And this is something that could lead-in to bears taking a greater role with near-term price action.
Gold Weekly Price Chart
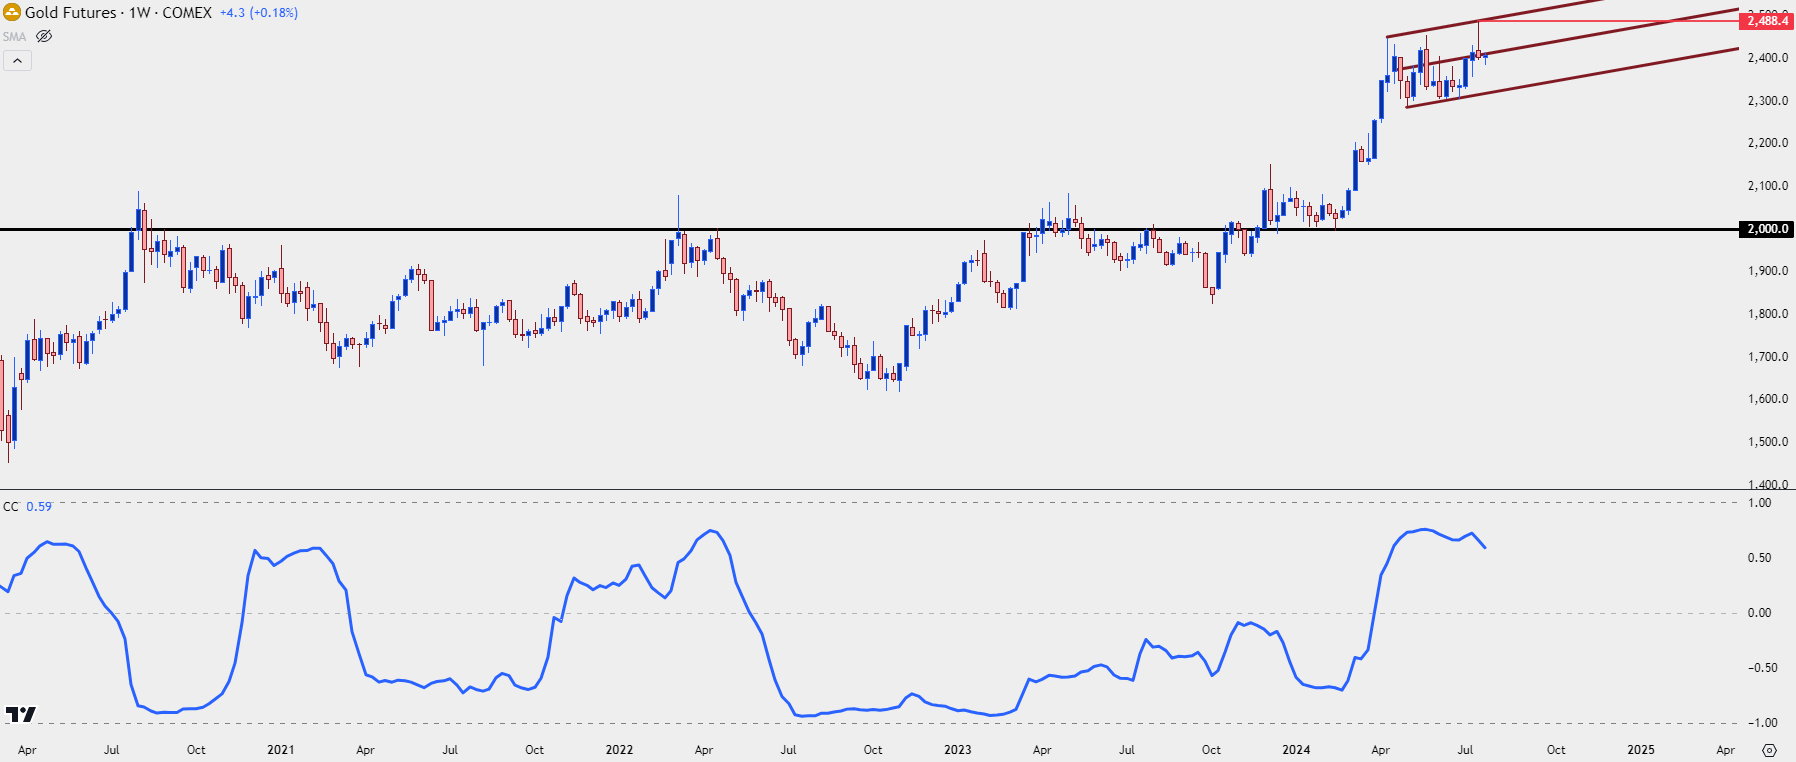 Chart prepared by James Stanley; data derived from Tradingview
Gold Shorter-Term
A formation is a possibility and we saw a couple of these instances in gold during Q2, when there was a descending triangle and even a head and shoulders pattern setting up. Neither triggered, which would’ve required a breach of support around $2300, so the same scenario can be applied to last week’s shooting star.
At this point, the big figures remain in-play as bulls have defended the $2,400 level now with today being the third consecutive day of that support. This aligns with the 50% mark of the recent bullish move and that $2,400 level is the same that buyers had difficulty gaining acceptance above during last quarter.
So, bulls still have an element of control on this basis of support defense, but if they begin to let it slip, there’s deeper support potential around $2375 and $2350, after which the same $2300 that was defended multiple times over the past few months comes back into the picture.
Gold Daily Price Chart
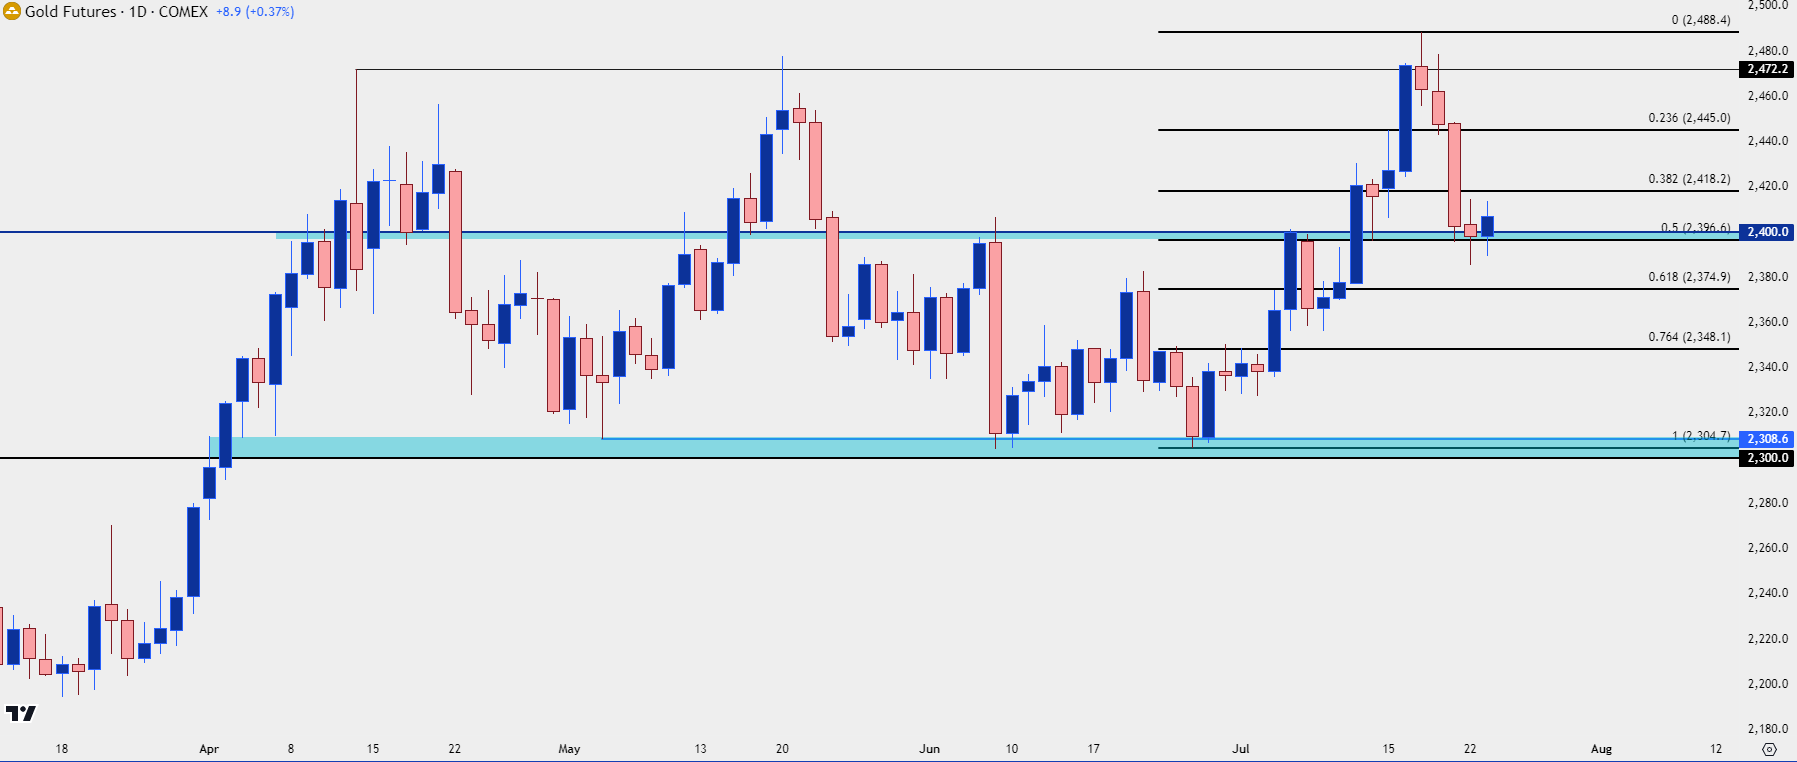 Chart prepared by James Stanley; data derived from Tradingview
EUR/USD
On the long side of the USD, EUR/USD remains of interest.
Last week saw a major point of resistance come into play at 1.0943, which I had talked about in the Tuesday webinar. On Wednesday, bulls stretched up for a test of that price and failed to drive further, leading into a strong pullback on Thursday around the ECB rate decision.
Notably, this same Fibonacci retracement helped to mark the high last year at the 61.8%, and the low so far this year at 1.0611 (the 38.2%).
EUR/USD Weekly Price Chart
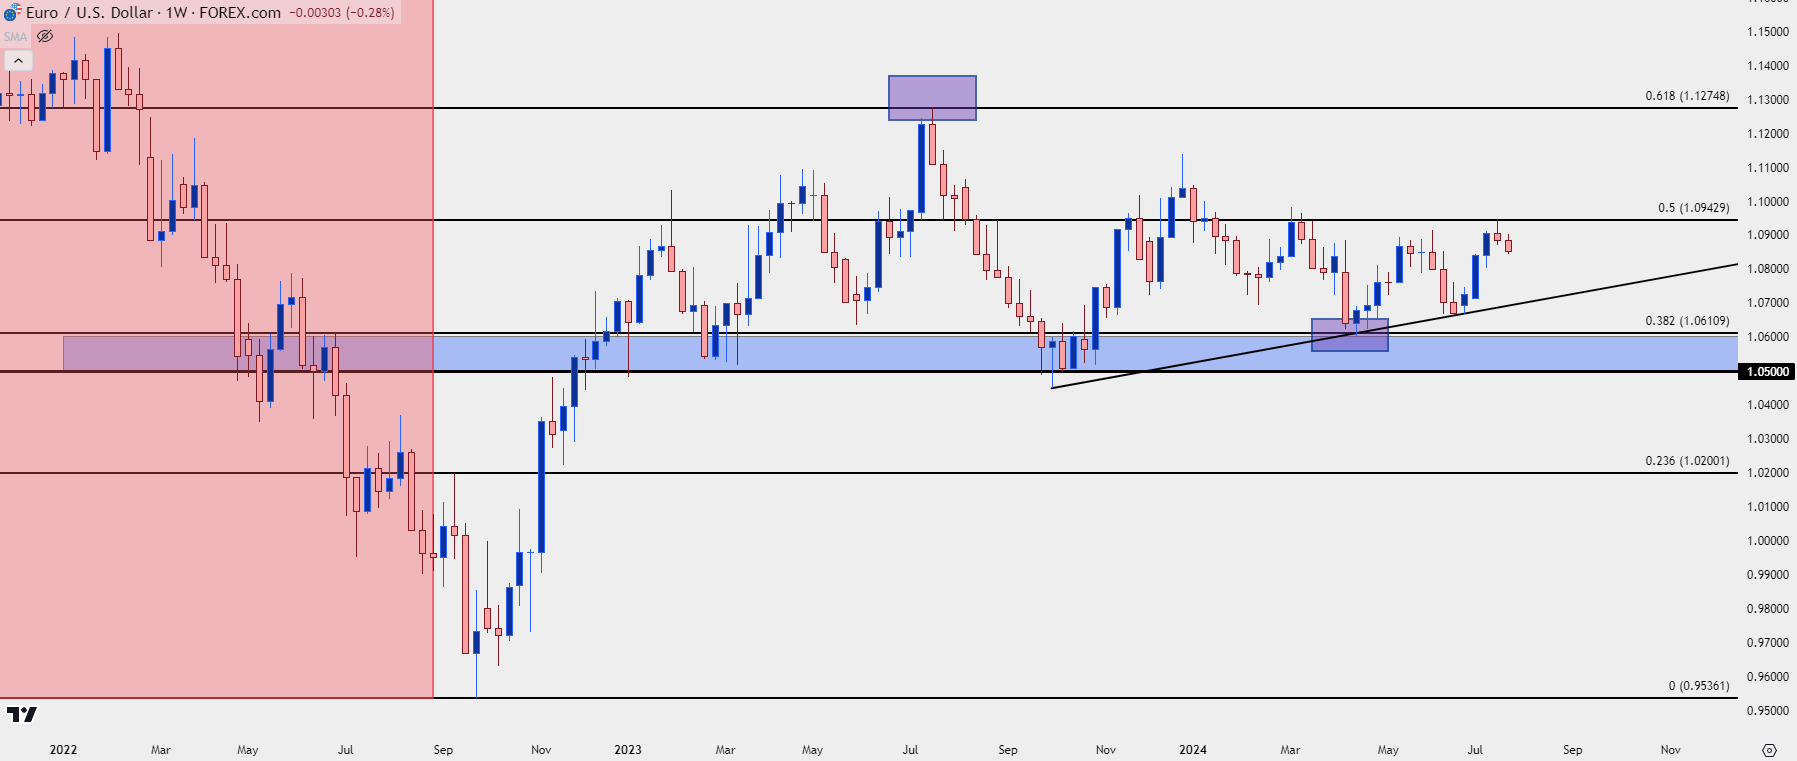 Chart prepared by James Stanley, EUR/USD on Tradingview
GBP/USD
GBP/USD has seen a stark change-of-pace over the past week.
Last week the pair was in the full drive of a bullish breakout, pushing towards a re-test of the 1.3000 psychological level that hadn’t traded since last July. There was also the matter of RSI on the daily chart, going deeply into overbought territory (near the 75 mark).
As USD strength showed up on Thursday after the ECB rate decision, a mark was made in GBP/USD as the pair fell back-below the 1.3000 level and continued to sell-off.
But, at this point, there could be potential for bullish continuation: RSI is no longer overbought on the daily and there’s been a show of support at prior resistance, taken from the March swing high.
GBP/USD Daily Price Chart
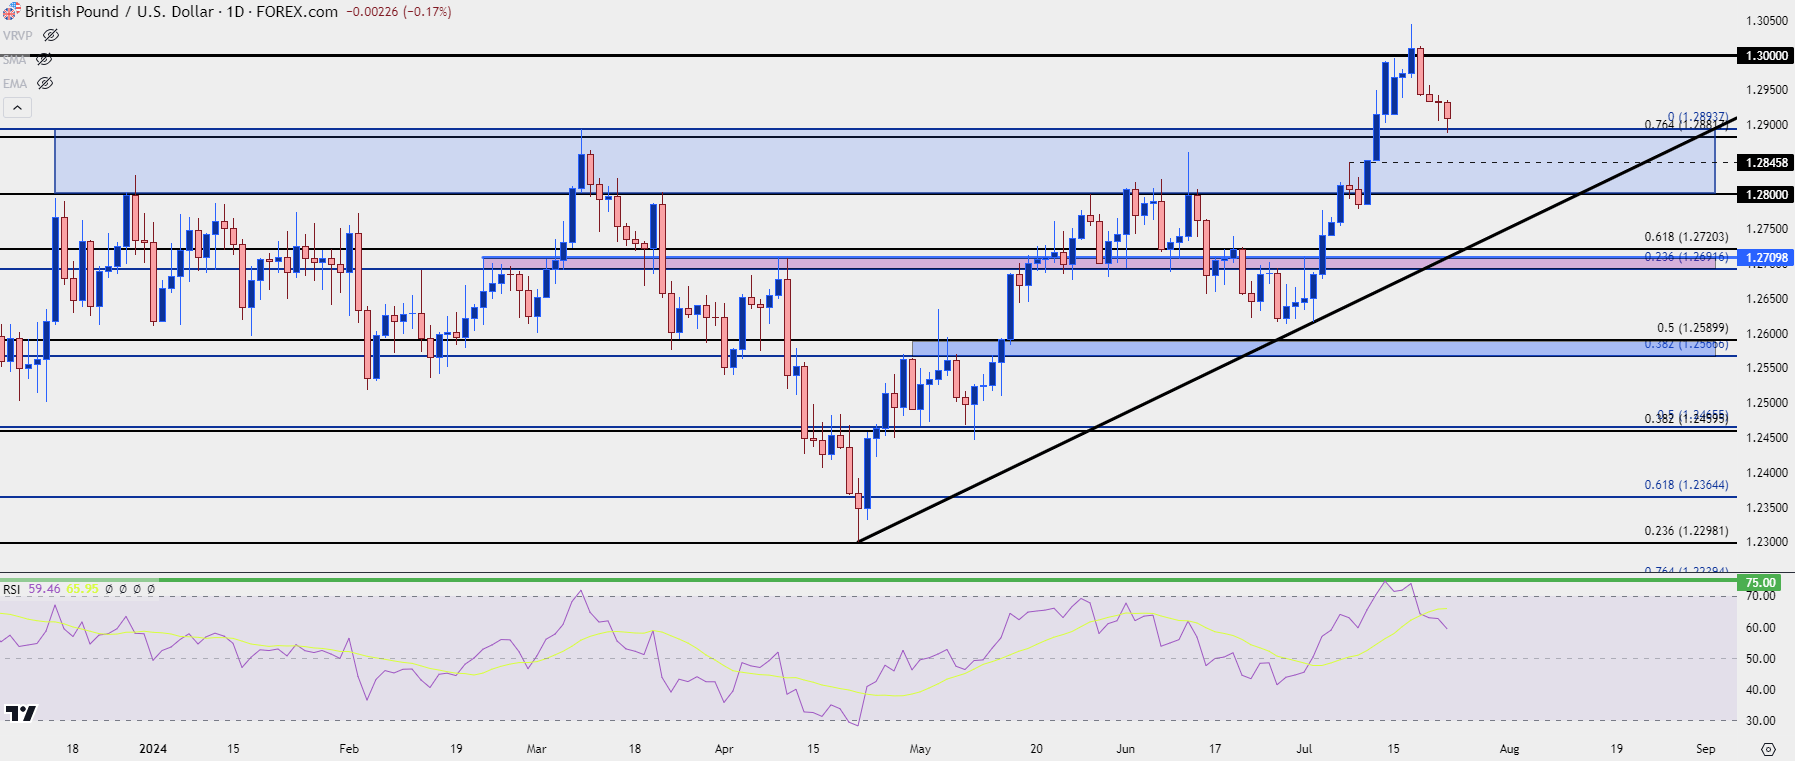 Chart prepared by James Stanley, GBP/USD on Tradingview
USD/JPY
USD/JPY is continuing to show symptoms of unwind and given the generally strong recent backdrop behind DXY, this is of interest.
Previously USD/JPY was probably one of the more attractive options for long-USD scenarios. The carry remained tilted to positive on the long side of the pair, and negative on the short side. This serves as a form of incentive, and it had been an incredibly forceful driver over the past few years.
But – ever since the intervention after US CPI a couple of weeks ago, it seems as though a behavioral change may be taking place, where sellers are hitting the pair after bounces up to lower-highs. In USD/JPY, this puts the focus on 155 and 152 to see if that changes anything. But – for those looking for Yen-strength on the back of greater carry unwind potential, there could be another pair of interest that I’ll look at below.
USD/JPY Daily Price Chart
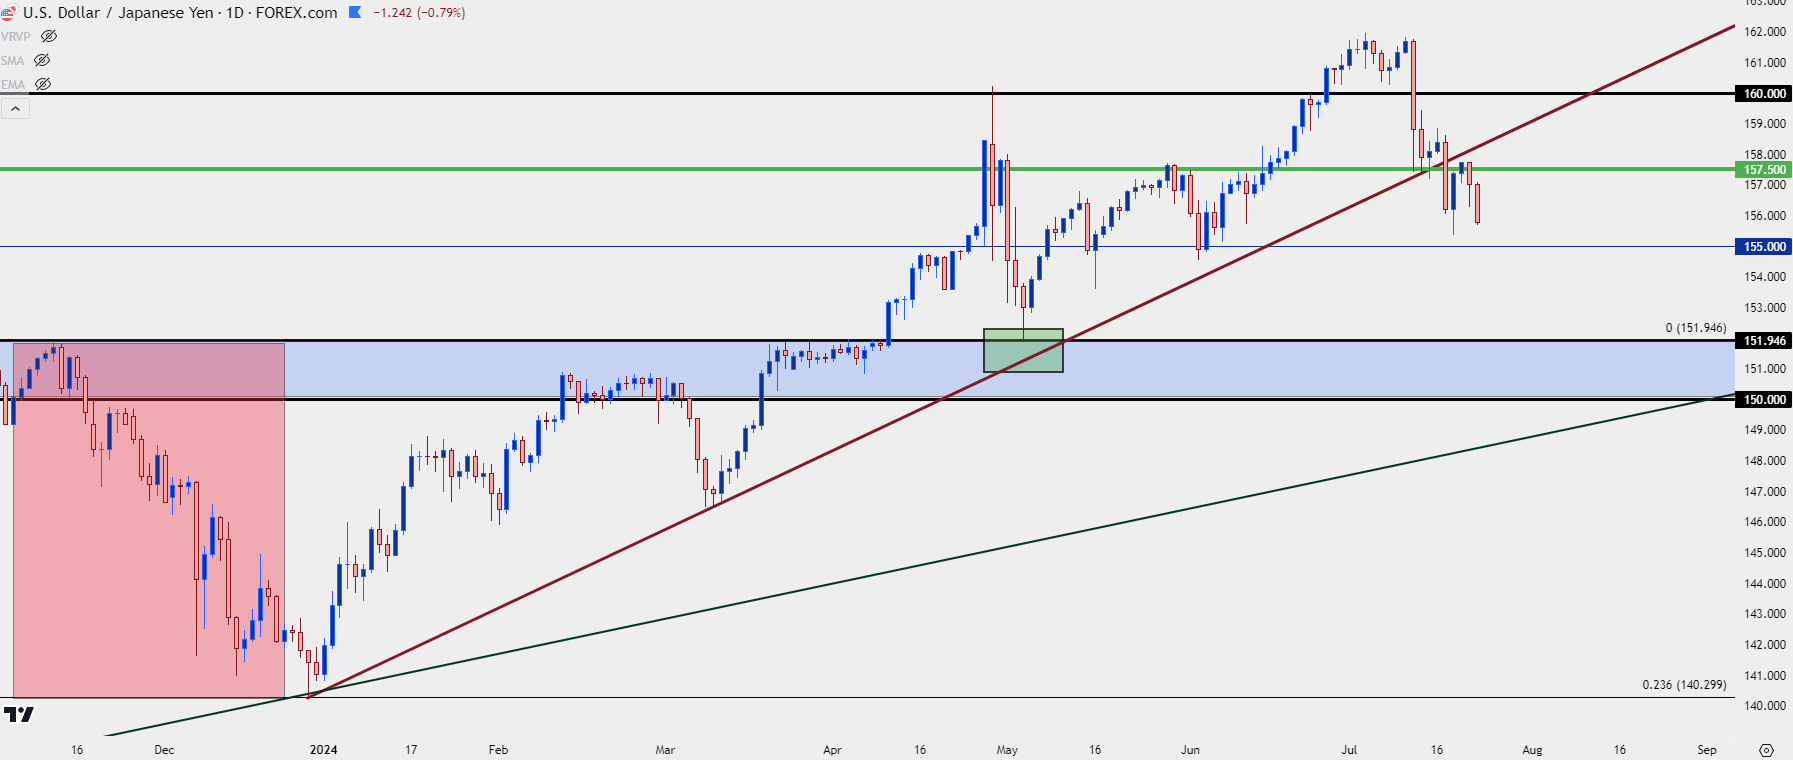 Chart prepared by James Stanley, USD/JPY on Tradingview
EUR/JPY
While USD has shown relative strength against the Euro and British Pound of late, EUR/JPY has been pushing through some key support levels. The 170 level had led to support defense last week – but sellers merely re-turned on a re-test of the 171.62 level, leading to another lower-high.
That move has so far continued and now EUR/JPY has driven back-below the 170.00 handle while also testing below a bullish trendline that makes up the support side of a rising wedge formation.
EUR/JPY Daily Price Chart
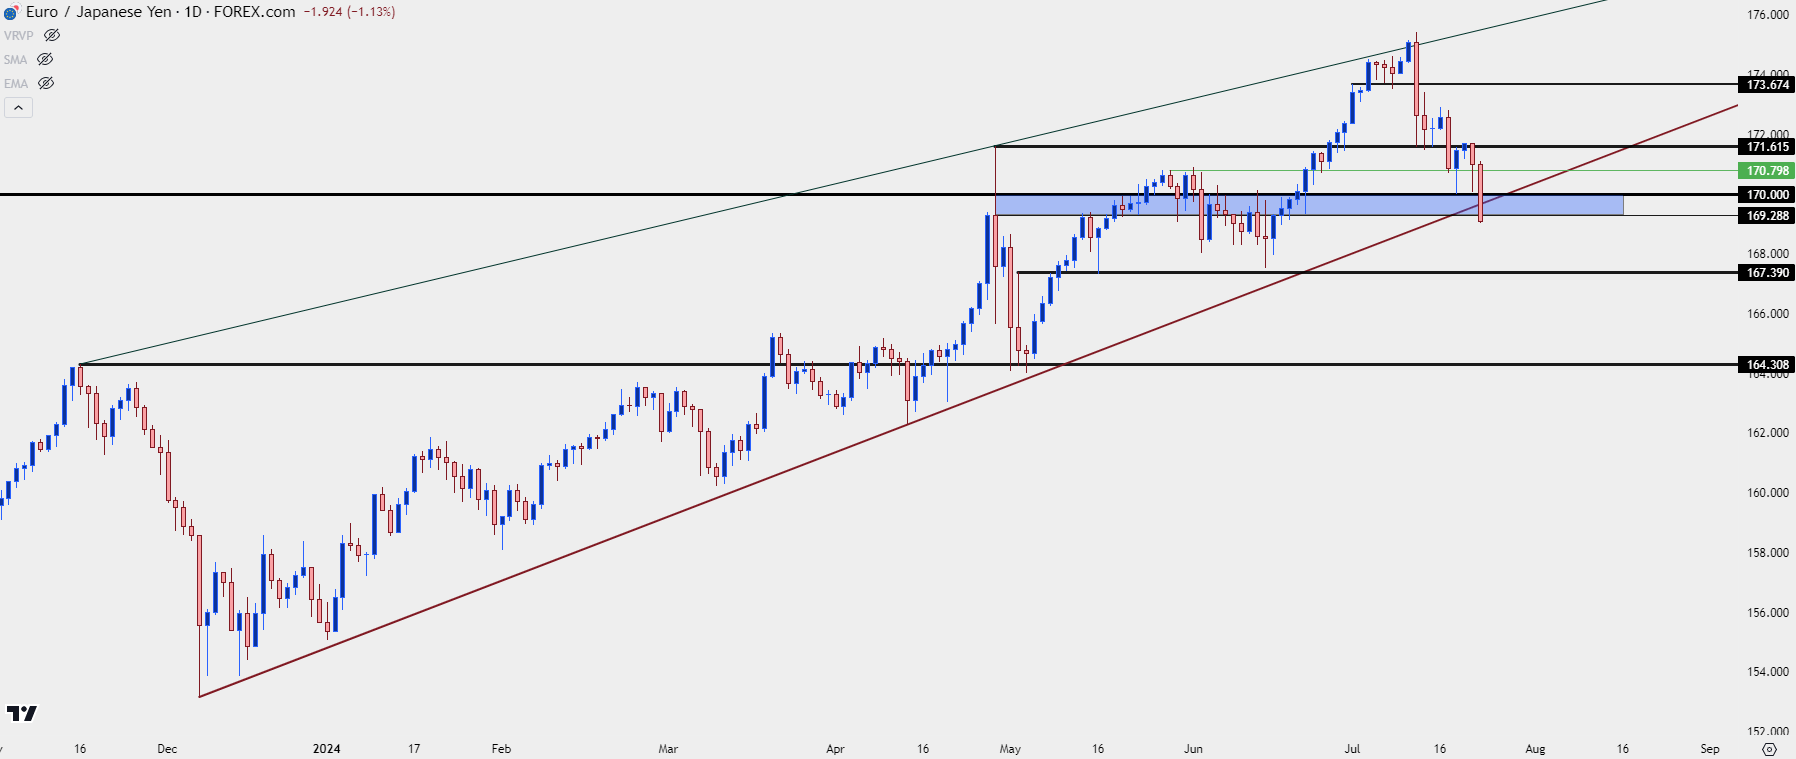 Chart prepared by James Stanley, EUR/JPY on Tradingview
--- written by James Stanley, Senior Strategist


