Gold Talking Points:
- Gold prices haven’t had much for pullbacks since the post-FOMC rally a few weeks ago, with some selling showing in early trade this week.
- As looked at in the webinar on Tuesday and the video yesterday, prices had held above the 2600 psychological level that was notable resistance after the Fed’s rate cut announcement.
- I follow these setups in the weekly webinar each Tuesday. Click here for registration information.
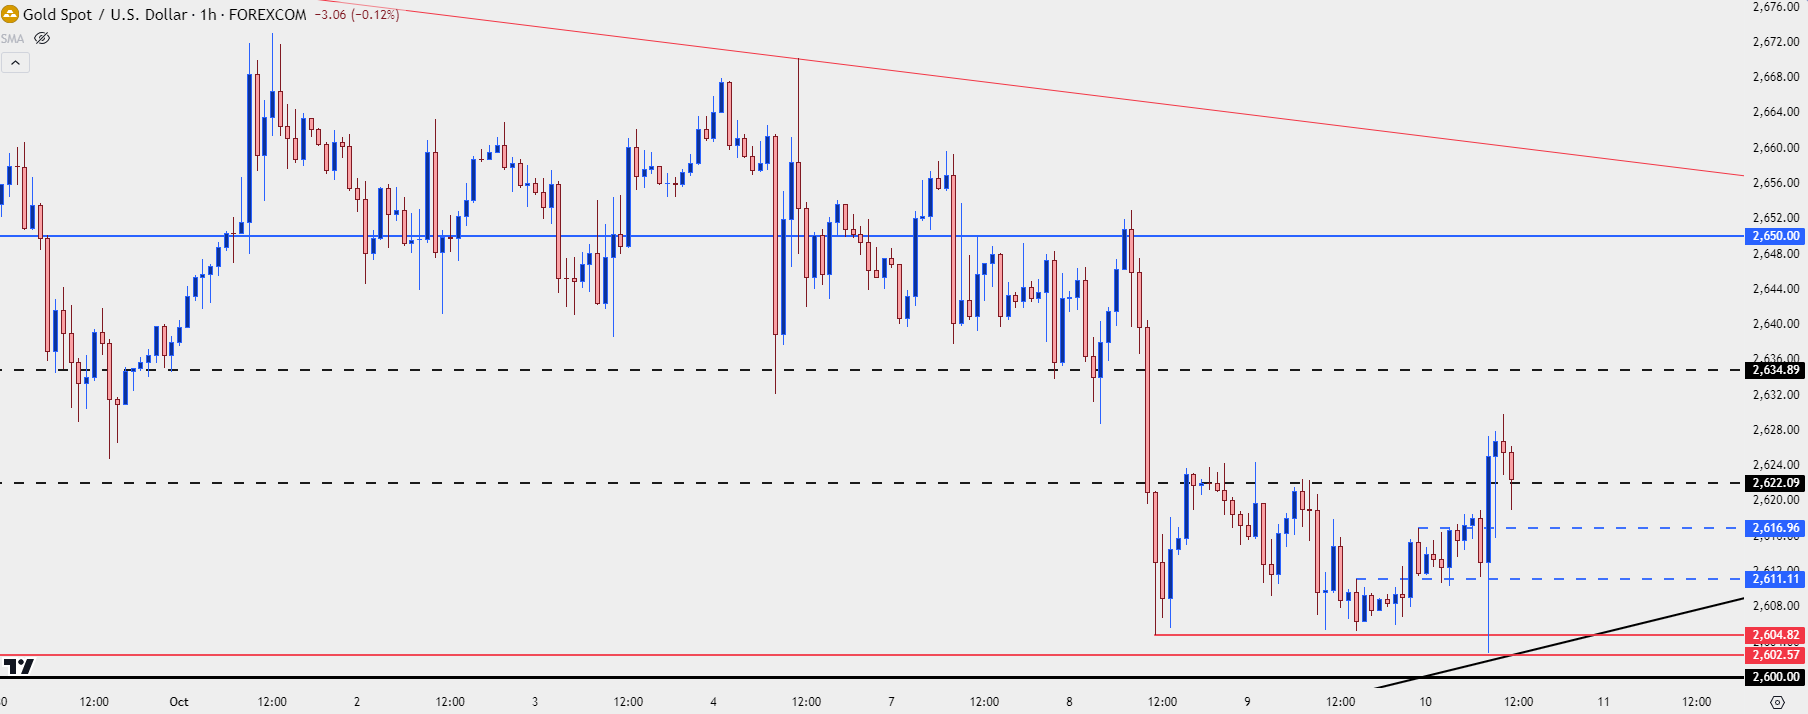
Gold bulls are pushing after this morning’s release of CPI data, which showed an above-expected print for both headline and Core CPI in the United States. But perhaps more attention grabbing was the surprise in initial jobless claims. That helped to bring an initial reaction of weakness to the USD which has largely been faded-out since, but in Gold, buyers are still pushing, trying to hold higher-lows after the morning bounce.
Gold Hourly Price Chart
 Chart prepared by James Stanley; data derived from Tradingview
Gold Big Picture
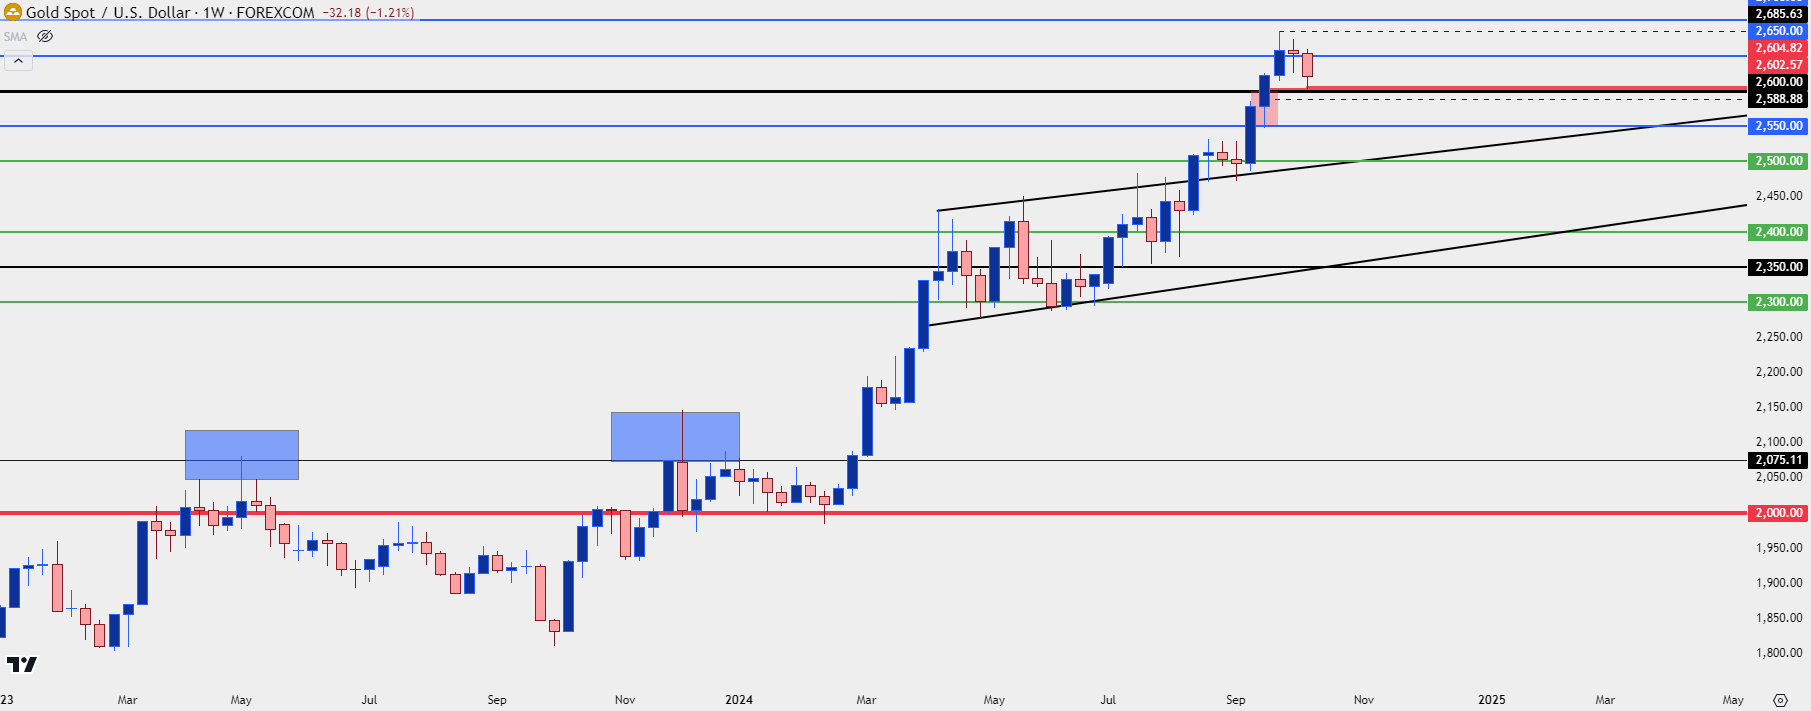
The trend in gold so far this year has been impressive. As markets geared up for eventual rate cuts from the Fed, gold prices surged higher in anticipation. Normally with a breakout like we saw in March and April, there’ will be a pullback as longs take profits. But that was incredibly mild on a relative basis with a bullish channel forming and holding for most of Q2.
Another breakout developed in the middle of Q3 as gold finally worked to gain acceptance of the 2500 psychological level and buyers didn’t really look back, continuing to push despite overbought readings on both the monthly and weekly charts of gold.
And even last week – when the US Dollar showed its strongest weekly gain in more than two years, gold bulls barely blinked, leaving a doji on the weekly chart.
This week has been the first notably pullback that we’ve seen since the August breakout and, so far, bulls have defended the 2600 level quite well.
Gold Weekly Price Chart
 Chart prepared by James Stanley; data derived from Tradingview
Gold Strategy
As I’ve been saying, gold is overbought but I’m not sure how much that matters right now given fundamental headwinds. The Fed wants to cut, that seems clear to me, the big question at this point is how fast the data will allow them to move.
Last week’s move of USD-strength came alongside rate cut bets being pushed into 2025 but, at this point, even with CPI holding well-above the Fed’s 2% target and last week’s NFP report showing strength on all three data points, rate cut bets remain and I think that can continue to support the fundamental backing behind bullish trends in gold.
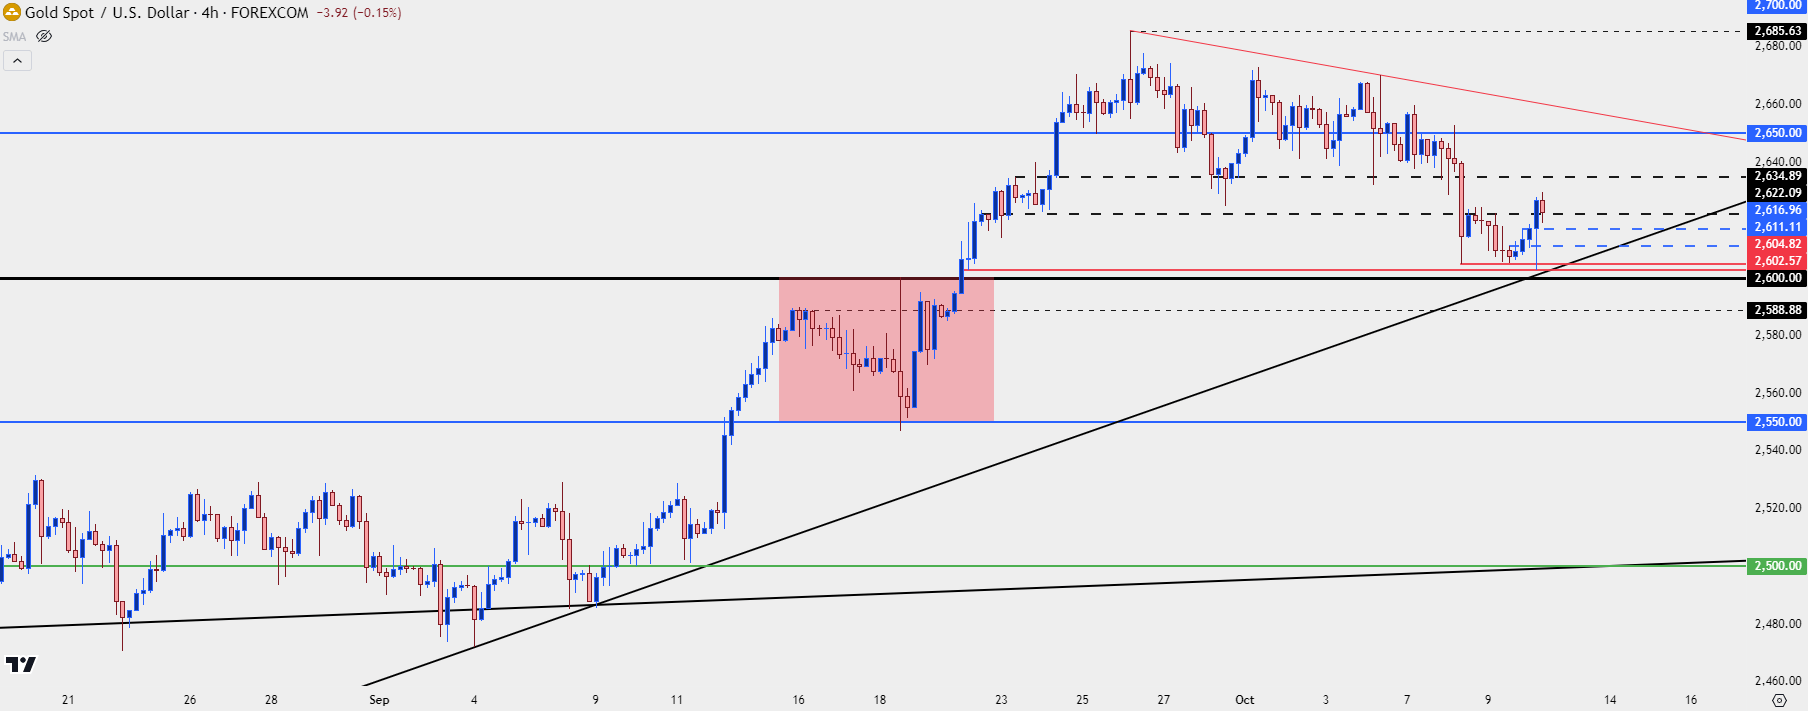
For strategy, however, this is going to come down to just how aggressively one wants to approach the situation. I talked about this at-length in the Tuesday webinar but so far we’ve seen ardent defense of the 2600 level, which happened again this morning. The swing-low of 2602.57 was the low that came into play after the FOMC move, which saw a short-term sell-off from 2600 before bulls piled back on and drove another breakout.
I’m considering this morning’s move as a show of defense from that and that’s a bullish sign. But 2035 is now of interest as this is a spot of resistance turned support that could prod a lower-high if it holds. And there’s been a tendency for gold to show large moves on Fridays. So if we do see a lower-high at 2035, the next question is whether bulls can continue defense of 2600 and, if they can’t, a deeper pullback points to swings at 2588 or perhaps even the post-FOMC support of 2550.
Gold Four-Hour Price Chart
 Chart prepared by James Stanley; data derived from Tradingview
--- written by James Stanley, Senior Strategist


