
Gold, USD Talking Points:
- The US Dollar has taken a beating over the past week.
- As that’s happened Gold has posted a massive breakout to another fresh all-time-high, trading above the $2,500 level for the first time ever. And EUR/USD and GBP/USD have put in strong topside moves. Bigger picture, questions remain around the USD/JPY carry trade and how much might be left to unwind, along with possible impact to other markets as addressed during this webinar.
- This is an archived webinar, and you’re welcome to join the next one: Click here to register.
Gold ATH
I started off the webinar with a look at gold and spot XAU/USD has shown a strong breakout to surge through the $2,500 level. As I shared then, this is a difficult spot for establishing bullish exposure and while the early-day strength was attractive, it’s still a move that I’m reticent to chase.
Instead, if looking bullish, there’s a plethora of possible support levels given the current price action structure. And if looking bearish, a weekly close below $2,500 will open the door for reversal or deeper pullback scenarios.
Notably, there’s a large driver between here and that weekly close and it’s FOMC Chair Powell’s speech at Jackson Hole this Friday.
Gold Daily Price Chart
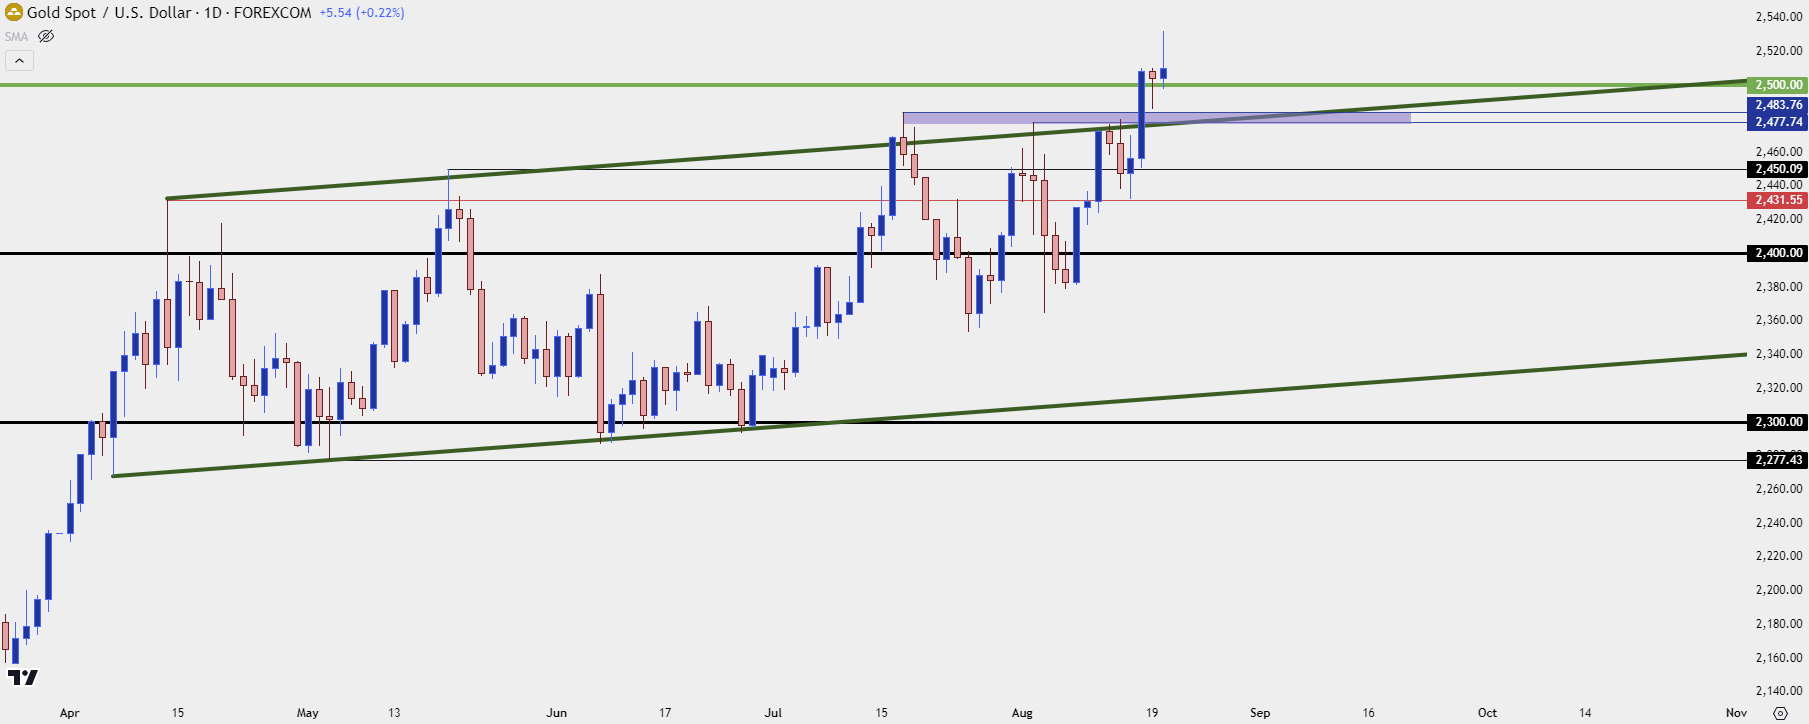 Chart prepared by James Stanley; data derived from Tradingview
USD Meltdown
The Dollar has seen a continued sell-off and at the time of the webinar, there was no evidence of a low being in-place. With that said, given how stretched the move has become, this is an incredibly difficult trend to chase, which highlights possible supports at 101.34 or 100.62 for potential reversal setups.
If neither of those come into play, there’s prior lower-highs that could be used to look for oncoming bullish structure, which could begin to open the door for pullback themes. As drawn up in the webinar, those plots at 101.77 and then 102.00.
US Dollar Four-Hour Price Chart
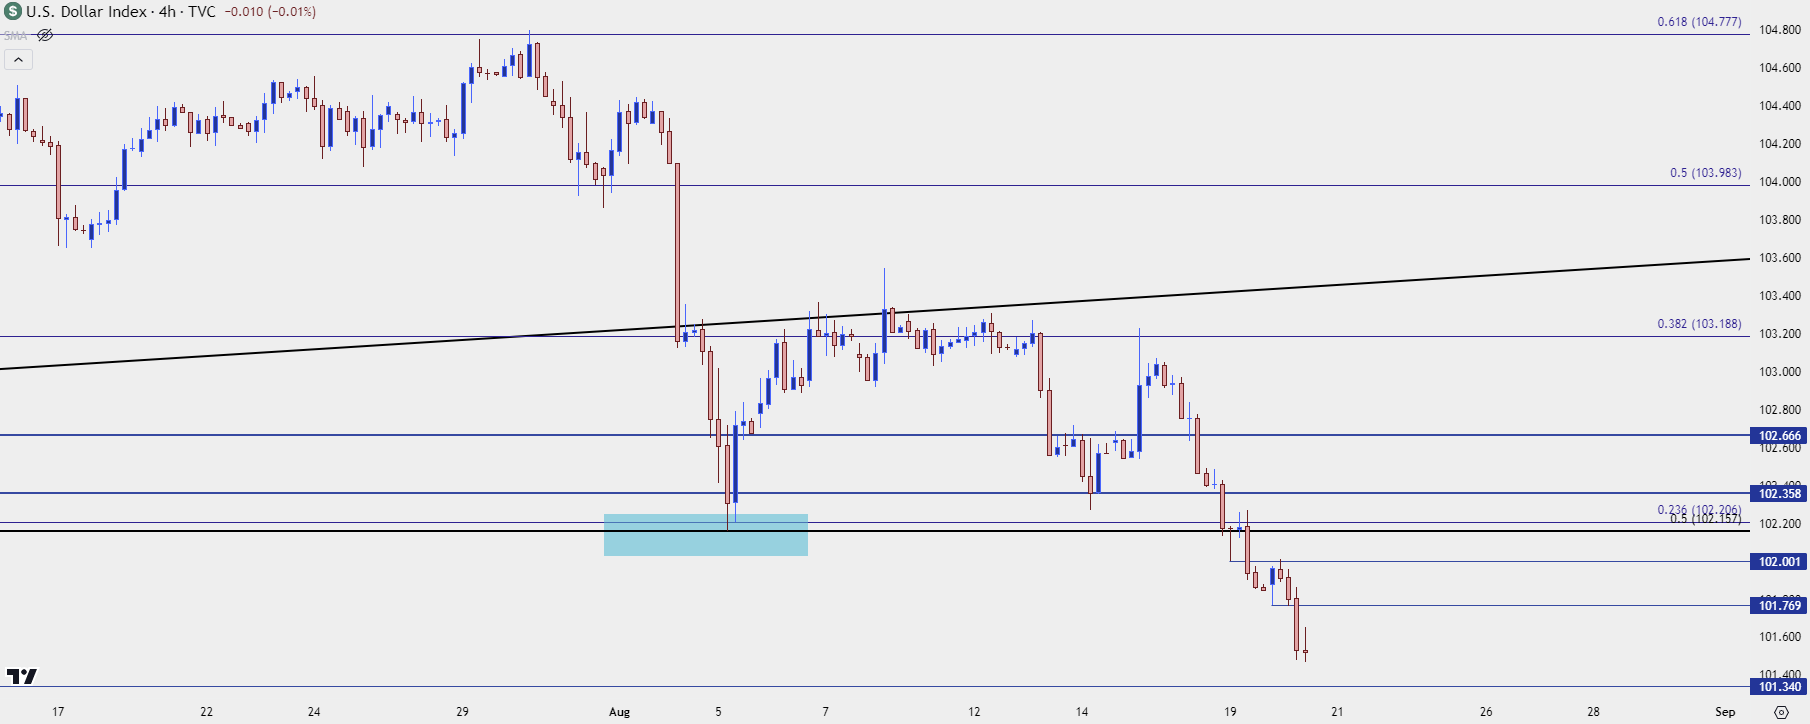 Chart prepared by James Stanley; data derived from Tradingview
EUR/USD
Given the meltdown-move in the USD looked at above, EUR/USD has shown a strong topside breakout. And the European economy isn’t something I’m necessarily excited about and with the pair pushing well past the 1.1000 level, I’m hard-pressed to be excited about bullish continuation. But with that said, like the USD above, there’s no context yet for playing reversals.
The level that I’m tracking for such in EUR/USD is the 1.1140 price that currently sets the yearly high. And for bearish structure, I have support zones at 1.1074-1.1081 and then 1.1034-1.1047, which if traded through, would begin to show sellers taking a strong handle on the matter.
EUR/USD Daily Price Chart
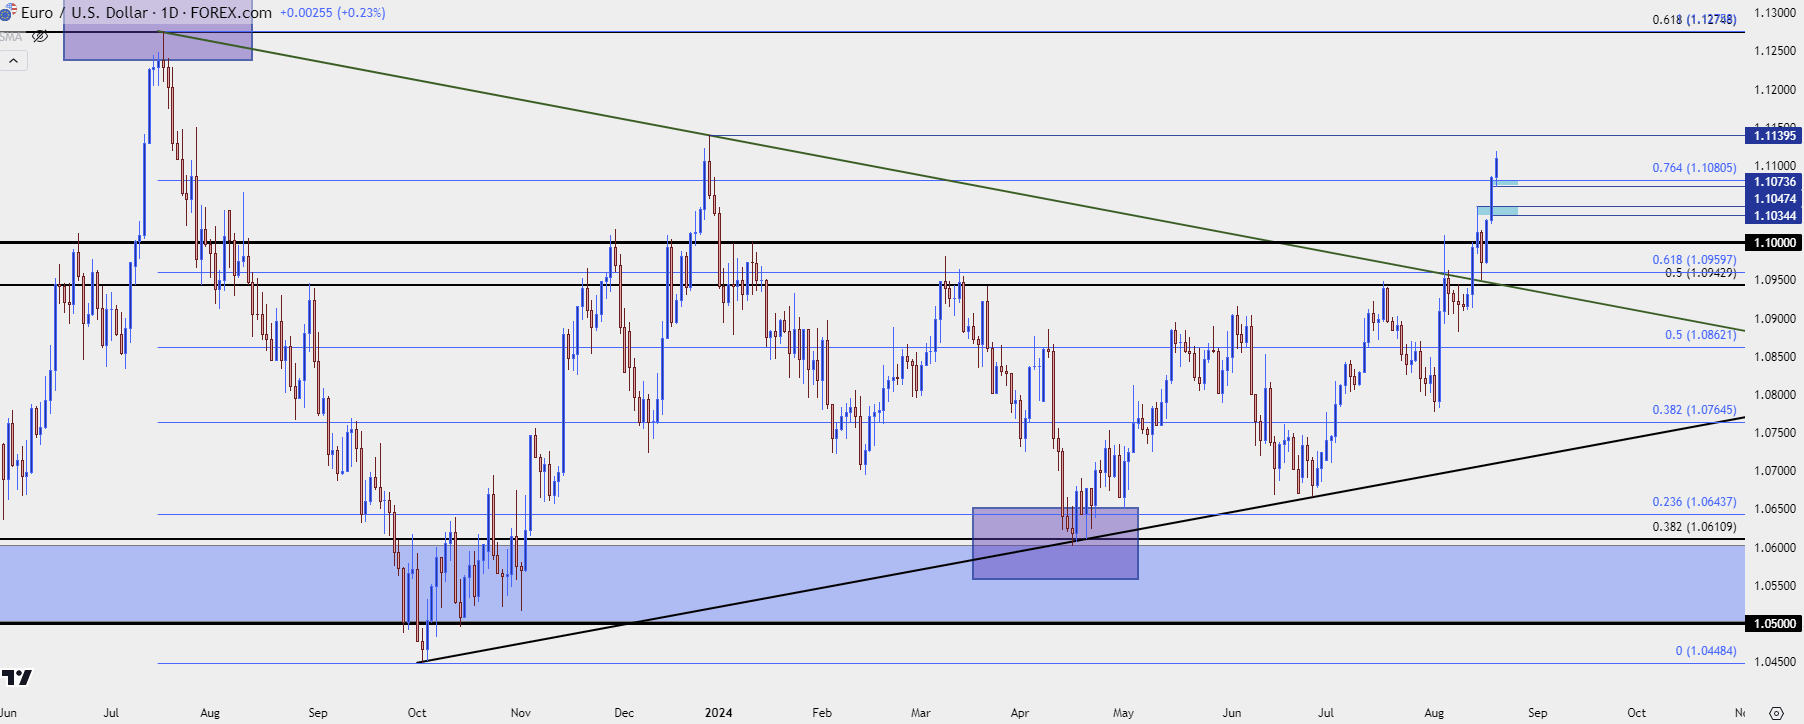 Chart prepared by James Stanley, EUR/USD on Tradingview
USD/JPY
I believe that we’re still seeing carry unwind taking place in USD/JPY and I spent a big portion of the webinar talking about relationships with this.
While USD/JPY carry unwind was often cited as a primary driver of the sell-off in equities, the evidence from the past couple of weeks suggests that it wasn’t the only driver, and my contention has been that recession worries were or are a bigger threat to equities.
At this point, stocks remain perched near recent highs but the reaction in USD/JPY over the past few days suggests additional unwind taking place. USD/JPY held a big spot of resistance last Thursday and sellers took over on Friday and Monday.
The 145.00 level will likely be another key test, and if we do see bulls show up, there’s more resistance overhead at 150 and 152.00.
USD/JPY Daily Price Chart
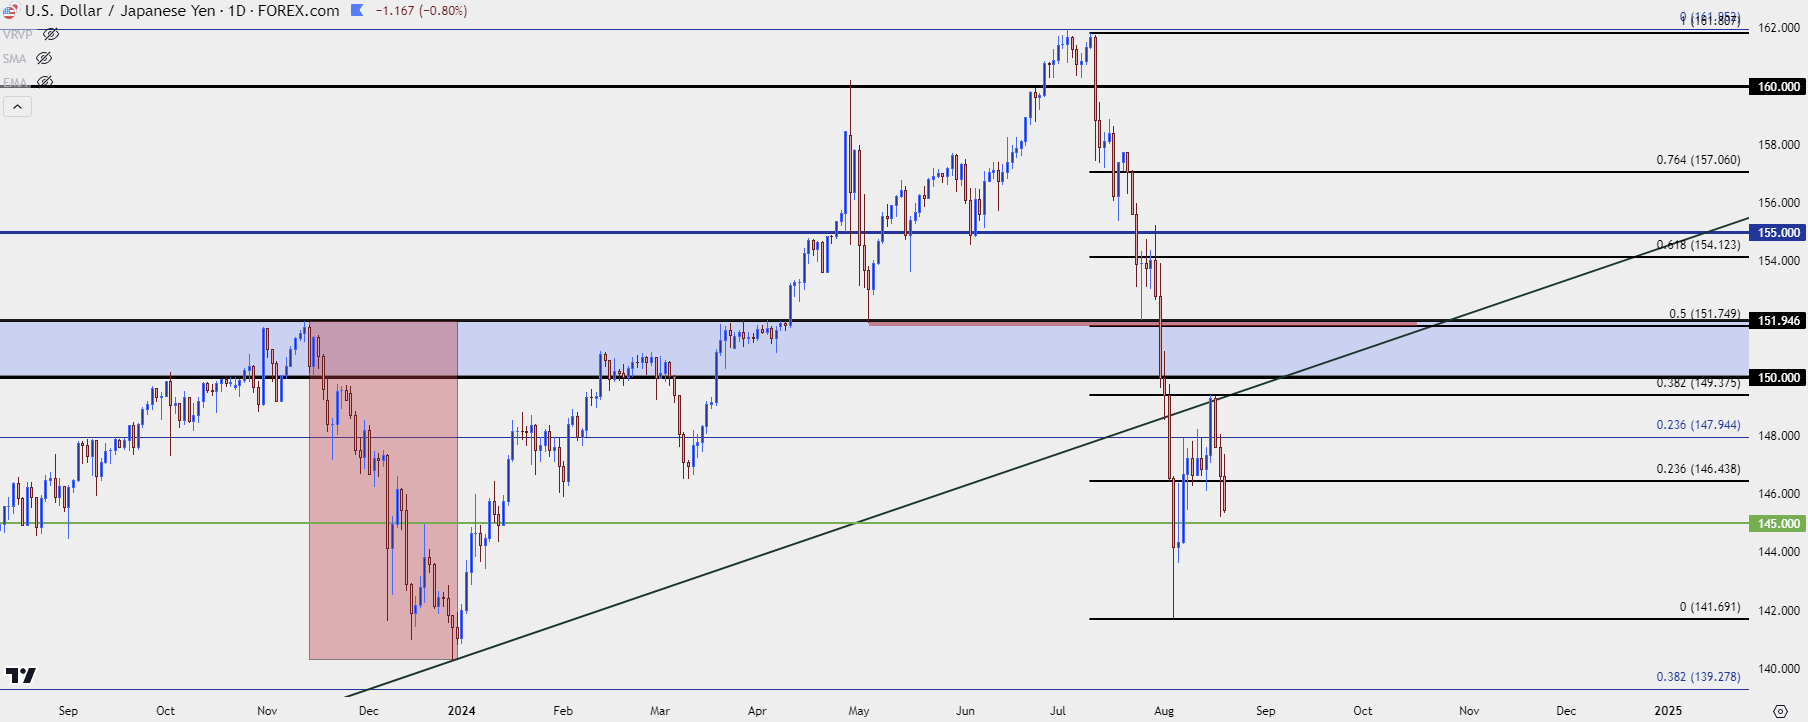 Chart prepared by James Stanley, USD/JPY on Tradingview
SPX
Equities have put in a massive rally from the lows of two weeks ago and at this point, S&P 500 Futures are within 2% of the all-time-highs that were set in July (and notably that high was set about a week after the BoJ intervention). It’s finally found a pause point at the ‘r1’ level looked at in yesterday’s SPX article.
But, as looked at on the webinar, structure is still very bullish and the prior resistance zone from 5562-5600 is now a major area for bulls to defend.
S&P 500 Futures Daily Price Chart
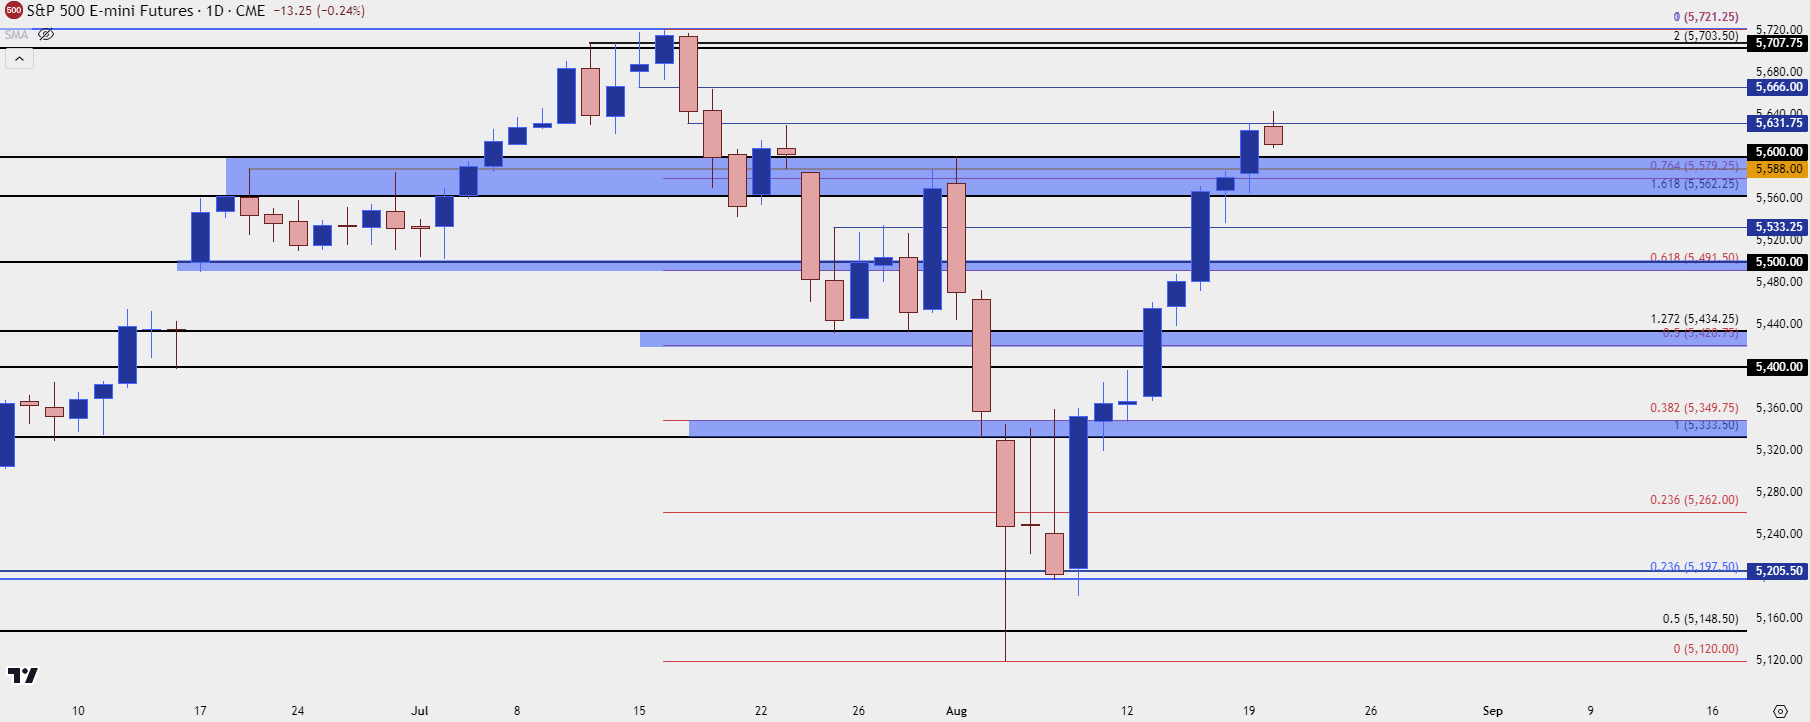 Chart prepared by James Stanley; data derived from Tradingview
Nasdaq
Nasdaq 100 Futures are showing a similar backdrop: The support that I’m tracking there is a zone of support-turned-resistance at 19,596-19,728.
Nasdaq 100 Futures – Daily Price Chart
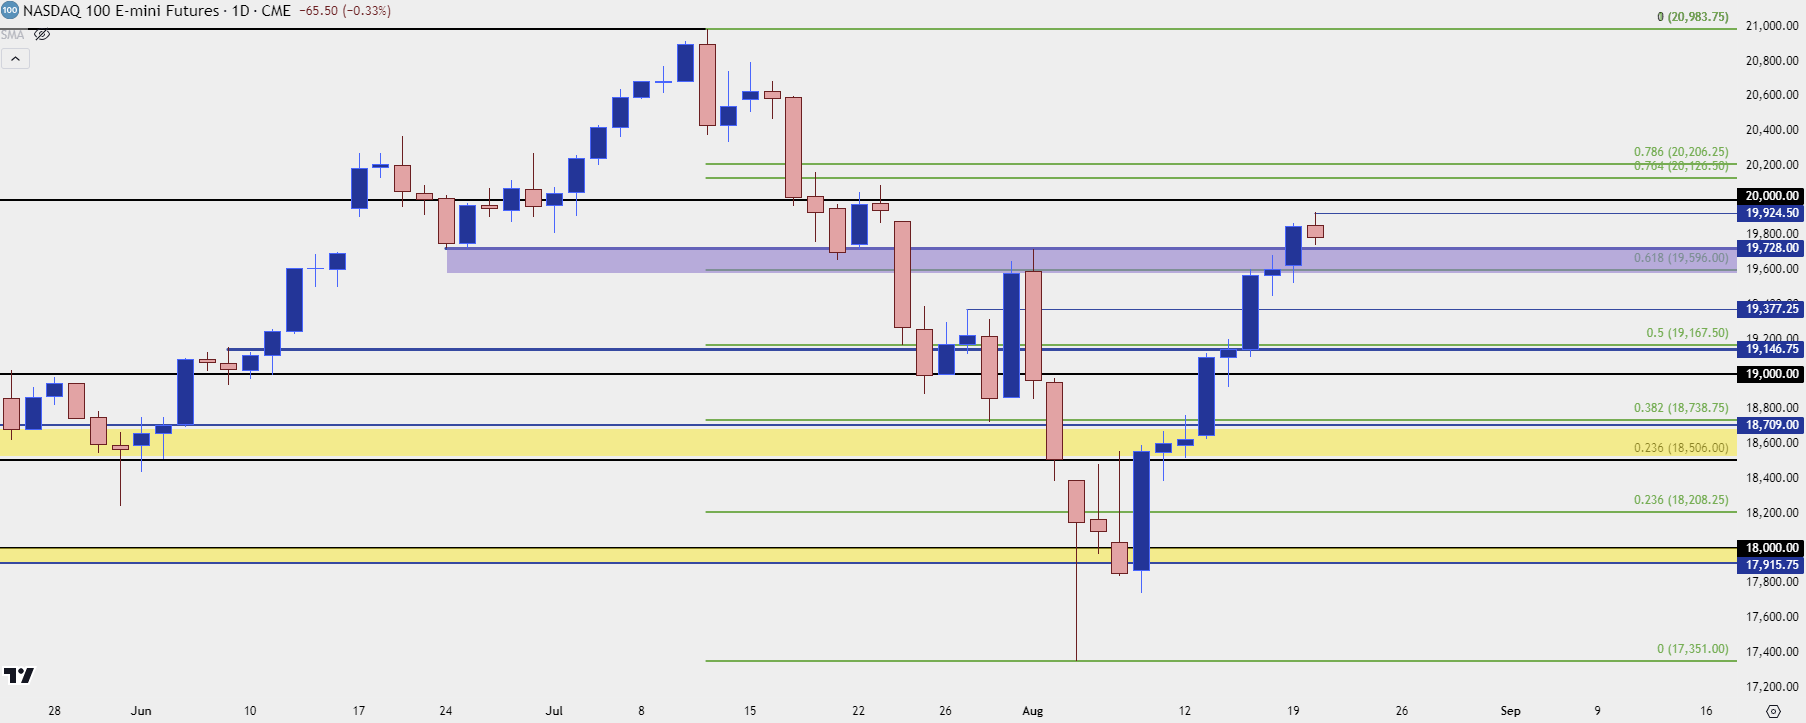 Chart prepared by James Stanley; data derived from Tradingview
--- written by James Stanley, Senior Strategist


