Many people look at Gold as a precious metal, beautiful and rare. Gold is sought after by the richest, most powerful, and most influential people in the world. It is tangible and finite, and therefore is used as a storage of value for many. The value of gold was so important during the early 1900s, that the value of the US Dollar was fixed to it. However, the end of the Bretton Woods Agreement in the early 1970s allowed the US Dollar to float versus other currencies worldwide. Still, many countries retain Gold as part of their reserves in the event of an unlikely monetary collapse.
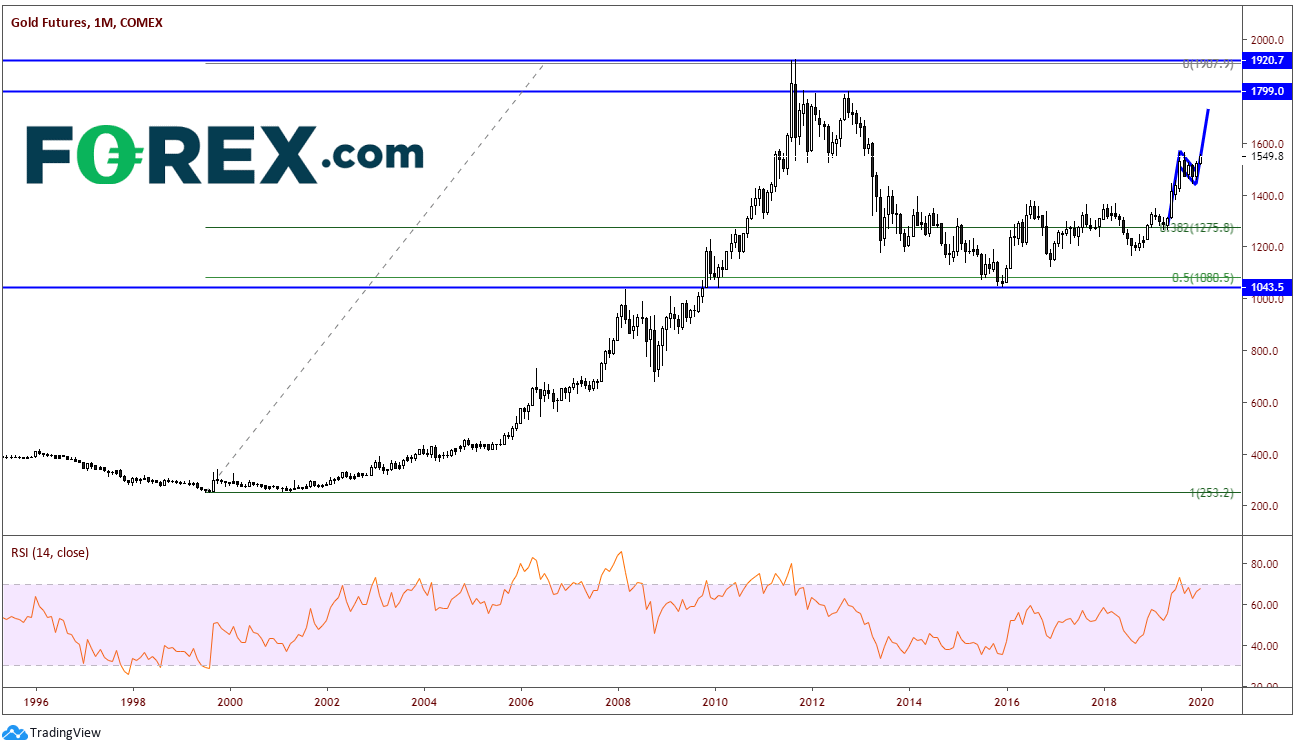
With stock markets soaring and putting in new daily all-time highs in the late 1990s, Gold was not as sought after. Looking at Gold Futures, the price was near $250 per troy ounce then. The price of Gold rose to as high as $1920 in 2011 as economies around the world were collapsing. Central banks had lowered interest rate to negative territory to keep them economies afloat.

Source: Tradingview, COMEX, FOREX.com
Since then, the price of Gold has retraced 50% of that move in 2015 and has been in a relatively stable sideways channel from 2013 until June 2019 between $1050 and $1400.

Source: Tradingview, COMEX, FOREX.com
What has emerged since May 2019 has been one of the most beautiful things I have ever seen: A TEXTBOOK PENNANT FORMATION THAT IS IN THE PROCESS OF BREAKING OUT! Price rose from $1275 to $1567 between June and September of 2019. It then pulled back, minimally, to the 38.2% Fibonacci retracement level near $1455, forming the pennant. On December 23rd, price broke higher and hasn’t looked back since.

Source: Tradingview, COMEX, FOREX.com
The target for the breakout of a pennant formation is the length of the “pole” of the pennant added to the breakout point. I move the pole to the lower trendline of the pennant to lower the target (less risky). This puts the target price near $1720. The RSI is currently in overbought conditions as the price of Gold has moved up nearly 4.5% since breaking out. Don’t be surprised if price pulls back to near $1515 and retests horizontal support as the RSI unwinds.
Today alone, the price of Gold is up nearly 1.5% as the United States killed Iranian military leader Qassem Soleimani. Fears quickly escalated that this may turn into a larger Iranian/US conflict and a flight to safety ensued. In addition, many traders are still away after the New Year’s holiday and will return on Monday, so liquidity was thin. Depending on whether there is retaliation from Iran over the weekend, Gold may gap higher or lower on Monday morning. If Gold breaks above $1567, the path of least resistance could have Gold near the target sooner than later. Support is back at the $1515 level and then the breakout level near $1485.

Source: Tradingview, COMEX, FOREX.com
Regardless of the situation between the US and Iran, Gold has been moving higher for two weeks. Some may attribute it to year end or an overbought stock market. Whatever the reason, Gold has broken out of a beautiful pennant formation and appears to be heading towards the target!


