British Pound Outlook: GBP/USD
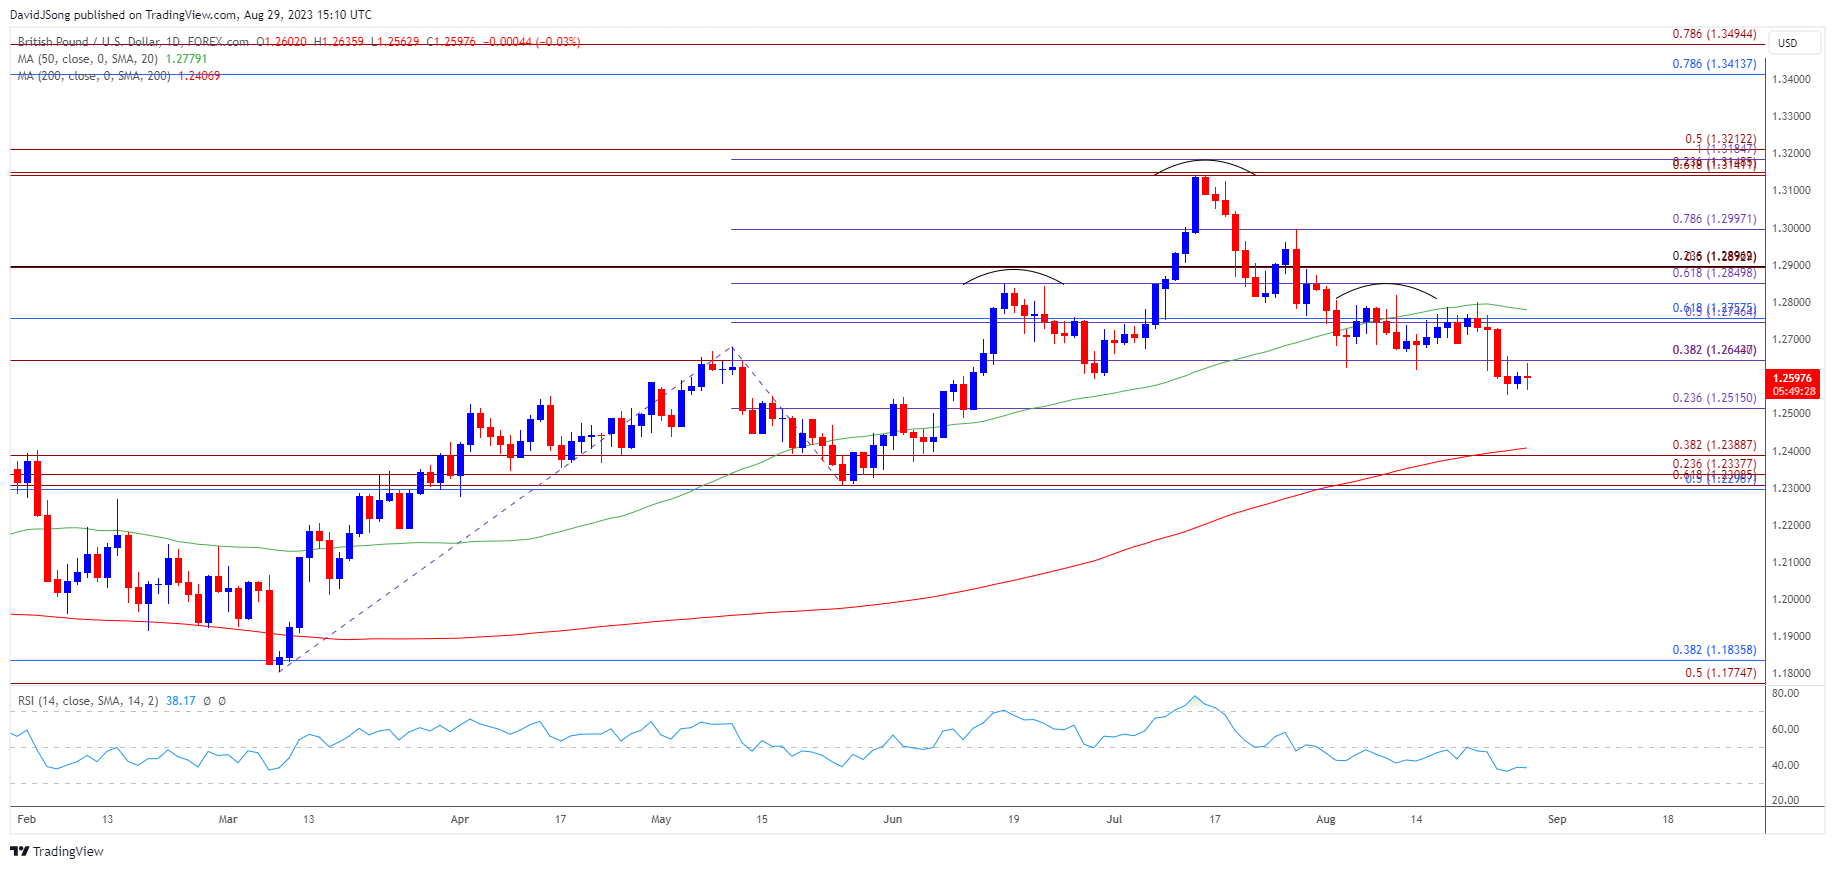
GBP/USD registered a fresh monthly low (1.2548) last week after failing to trade back above the 50-Day SMA (1.2779), and the exchange rate may continue to give back the advance from the June low (1.2369) as a head-and-shoulders pattern appears to be unfolding.
GBP/USD Vulnerable to Head-and-Shoulders Pattern
The British Pound outperformed its US counterpart for most of 2023 as GBP/USD traded to a yearly high (1.3143) in July, but the exchange rate may no longer reflect the bullish behavior amid the flattening slope in the moving average.
Join David Song for the Weekly Fundamental Market Outlook webinar. David provides a market overview and takes questions in real-time. Register Here
US Economic Calendar

At the same time, data prints coming out of the US may drag on GBP/USD as the update to the Personal Consumption Expenditure (PCE) Price Index, the Federal Reserve’s preferred gauge for inflation, is anticipated to show the core rate widening to 4.2% in July from 4.1% the month prior.
Signs of persistent price growth may generate a bullish reaction in the Greenback as it puts pressure on the Federal Open Market Committee (FOMC) to further combat inflation, and the Fed may prepare US households and businesses for higher interest rates as Chairman Jerome Powell reiterates that the central bank is ‘prepared to raise rates further if appropriate.’
CME Fed Watch Tool

Source: CME
In turn, speculation surrounding Fed policy may sway GBP/USD as the CME FedWatch Tool now reflects a greater than 40% probability for a 25bp rate-hike before the end of the year, but a softer-than-expected PCE print may produce headwinds for the US Dollar as FOMC seems to be nearing the end of its hiking-cycle.
With that said, developments coming out of the US may influence the near-term outlook for GBP/USD as it seems to be stuck in a narrow range, but the exchange rate may struggle to retain the advance from the June low (1.2369) as a head-and-shoulders pattern appears to be unfolding.
GBP/USD Price Chart –Daily

Chart Prepared by David Song, Strategist; GBP/USD on TradingView
- GBP/USD trades in a narrow range after registering a fresh monthly low (1.2548) during the previous week, while the 50-Day SMA (2.3779) seems to be developing a negative slope as the exchange rate struggles to trade back above the moving average.
- At the same time, a head-and-shoulders formation may unfold as GBP/USD failed to defend the opening range for August, with a break/close below 1.2520 (23.6% Fibonacci extension) raising the scope for a test of the June low (1.2369).
- Next area of interest comes in around 1.2300 (50% Fibonacci retracement) to 1.2390 (38.2% Fibonacci extension), but failure to break/close below 1.2520 (23.6% Fibonacci extension) may negate the head-and-shoulders pattern, with a move above the 1.2640 (38.2% Fibonacci extension) to 1.2650 (38.2% Fibonacci extension) region bringing the 1.2750 (50% Fibonacci retracement) to 1.2760 (61.8% Fibonacci retracement) zone on the radar.
Additional Market Outlooks
USD/JPY Pullback Keeps RSI Out of Overbought Territory
US Dollar Forecast: EUR/USD on Cusp of Testing July Low
--- Written by David Song, Strategist
Follow on Twitter at @DavidJSong


