GBP/USD Outlook
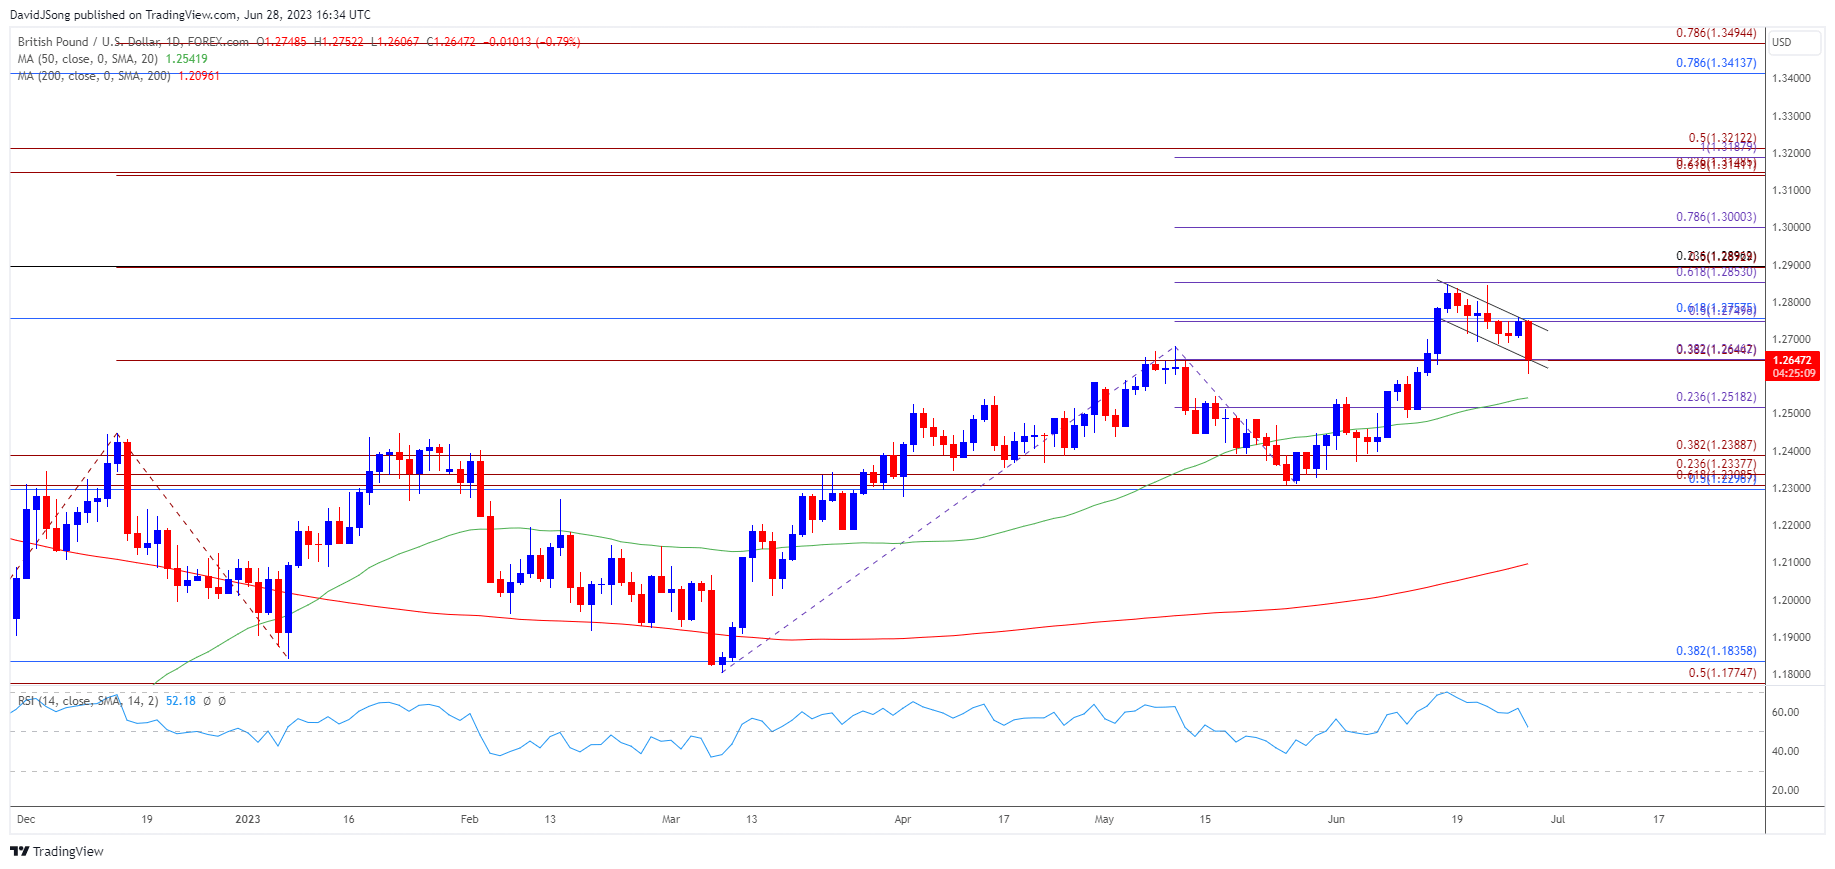
GBP/USD appears to be trading within a descending channel after failing to clear the monthly high (1.2848) during the previous week, and the exchange rate may continue to give back the advance from the June low (1.2369) if it fails to respond to the positive slope in the 50-Day SMA (1.2542).
GBP/USD Susceptible to Test of 50-Day SMA
GBP/USD seems to be unfazed by hawkish remarks from Bank of England (BoE) Governor Andrew Bailey as it trades to a fresh weekly low (1.2629), and the exchange rate may face a further decline over the remainder of the month even though the Monetary Policy Committee (MPC) pledge to ‘do what is necessary’ to combat inflation.
Join David Song for the Weekly Fundamental Market Outlook webinar. Register Here

Looking ahead, it remains to be seen if the update to the Personal Consumption Expenditure (PCE) Price Index will sway GBP/USD as the core rate, the Federal Reserve’s preferred gauge for inflation, is expected to hold steady at 4.7% per annum in May while the headline reading is projected to increase to 4.6% from 4.4% the month prior.
The threat of persistent inflation may generate a bullish reaction in the US Dollar as it puts pressure on the Federal Open Market Committee (FOMC) to pursue a more restrictive policy, and the central bank may reestablish its hiking-cycle at its next interest rate decision on July 26 as Chairman Jerome Powell and Co. project a steeper path for the Fed Funds rate.

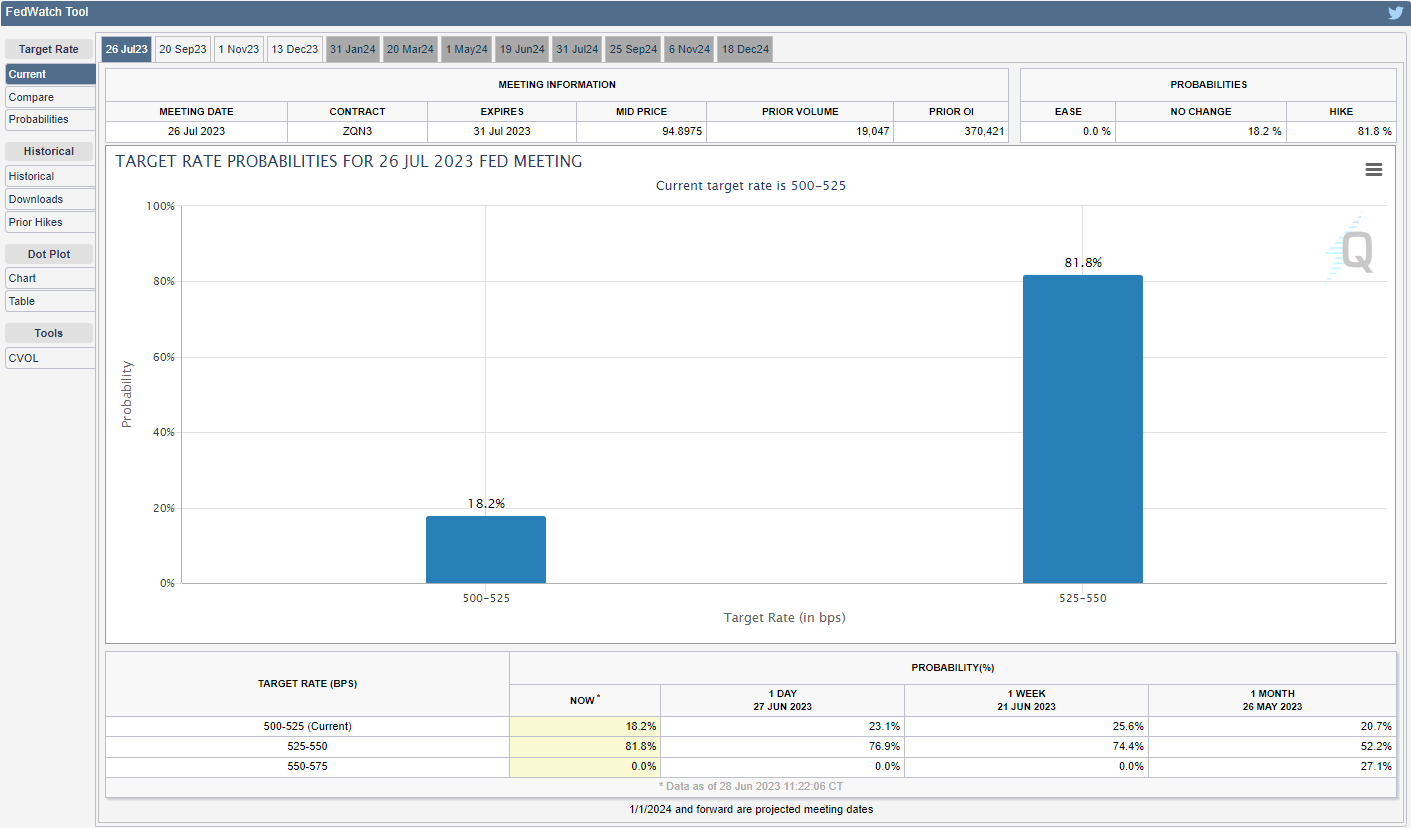
Source: CME
Until then, data prints coming out of the US may influence the monetary policy outlook as the CME FedWatch Tool still reflects a greater than 80% probability for a 25bp rate hike in July, and Fed officials may continue to strike a hawkish forward guidance ahead of the next meeting as inflation remains above the central bank’s 2% target.
With that said, stickiness in the core US PCE may drag on GBP/USD as it fuels speculation for a Fed rate hike, and the exchange rate may continue to give back the advance from the June low (1.2369) if it fails to respond to the positive slope in the 50-Day SMA (1.2542).
British Pound Price Chart – GBP/USD Daily

Chart Prepared by David Song, Strategist; GBP/USD on TradingView
- GBP/USD trades in a descending channel after failing to clear the monthly high (1.2848), with a close below 1.2650 (38.2% Fibonacci extension) bringing the 50-Day SMA (1.2542) on the radar.
- A move below the moving average opens up 1.2520 (23.6% Fibonacci extension), with the next area of interest coming in around 1.2300 (50% Fibonacci retracement) to 1.2390 (38.2% Fibonacci extension).
- However, a bull-flag formation may take shape if GBP/USD responds to the positive slope in the moving average, with a break/close above the 1.2750 (50% Fibonacci extension) to 1.760 (61.8% Fibonacci extension) raising the scope for another run at the monthly high (1.2848).
Additional Market Outlooks
Gold Price Struggles to Push Above Former Support
EUR/USD Fails to Test May High as Fed Officials Defend Higher Rates
--- Written by David Song, Strategist
Follow on Twitter at @DavidJSong


