GBP/USD Outlook
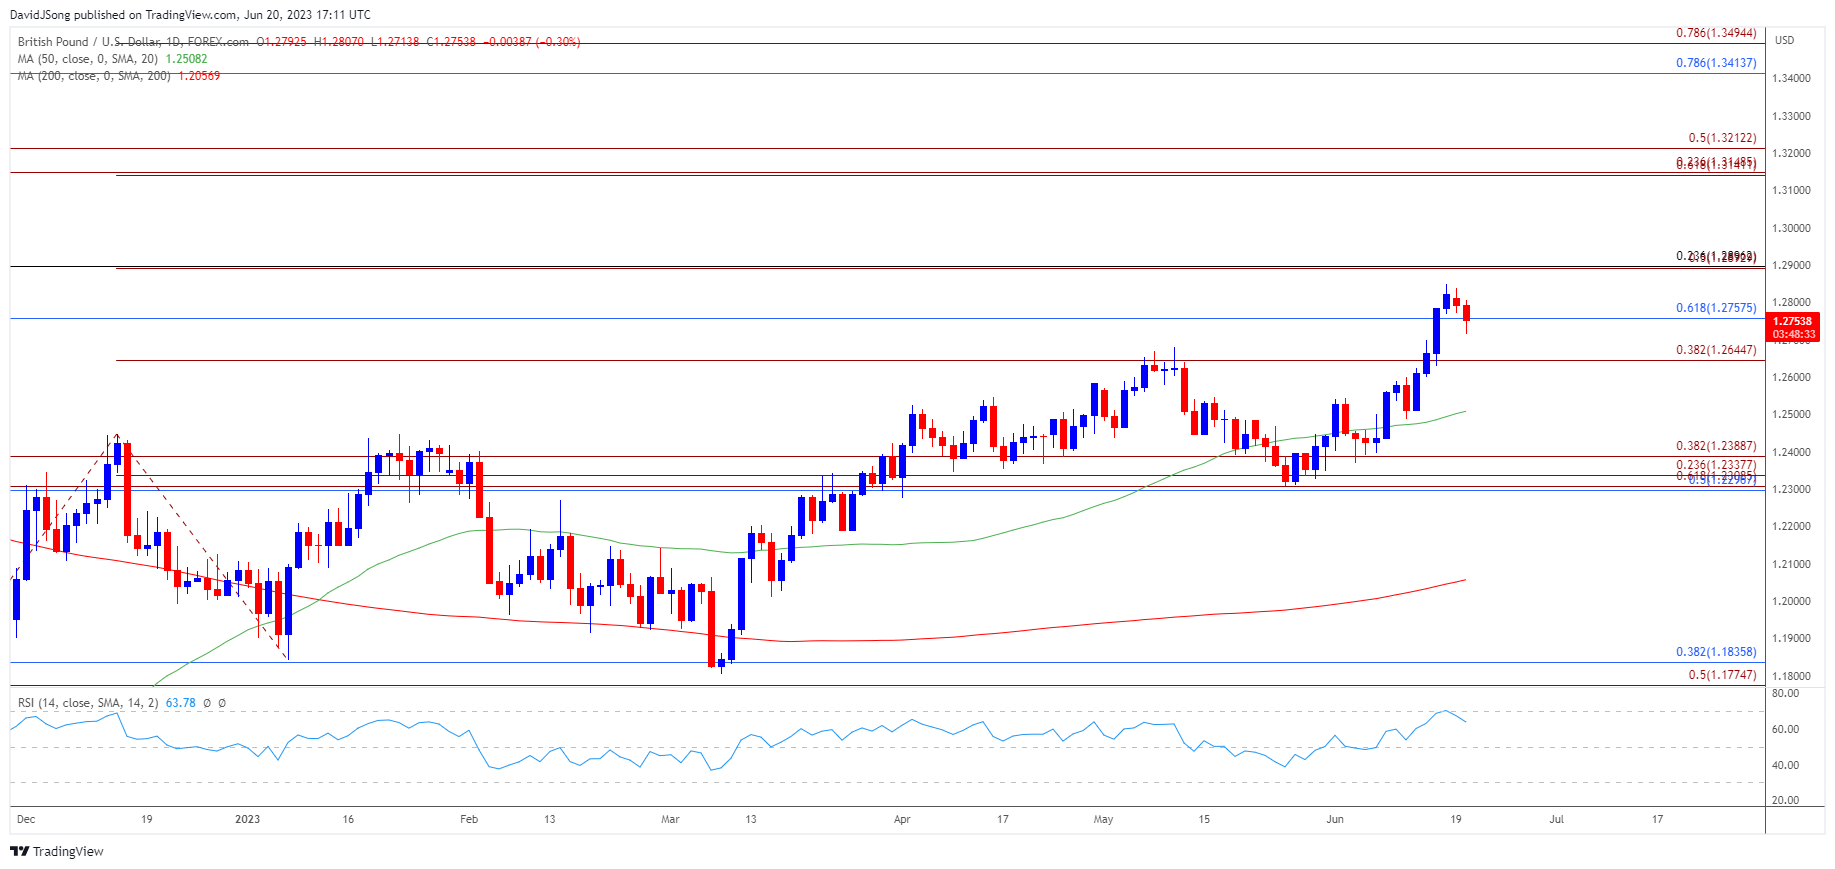
GBP/USD initiate a series of lower highs and lows after registering a fresh yearly high (1.2848) last week, with recent developments in the Relative Strength Index (RSI) raising the scope for a near-term pullback in the exchange rate amid the failed attempt to push into overbought territory.
GBP/USD Pulls Back to Keep RSI Out of Overbought Territory
The recent rally in GBP/USD may continue to unravel as the RSI falls back from its highest reading for 2023, and the update to the UK Consumer Price Index (CPI) may do little to prop up the exchange rate as the headline reading for inflation is anticipated to slow for the third consecutive month.
Join David Song for the Weekly Fundamental Market Outlook webinar. Register Here

The CPI is expected to narrow to 8.4% in May from 8.7% per annum the month prior, and evidence of easing price growth may generate a bearish reaction in the British Pound as it raises the scope for a larger dissent within the Bank of England (BoE).
It remains to be seen if there will be another 7-2 split as the updated projections in the BoE’s Monetary Policy Report (MPR) are ‘conditioned on a market-implied path for Bank Rate that peaks at around 4¾% in 2023 Q4 before ending the forecast period at just over 3½%,’ and Governor Andrew Bailey and Co. may prepare to pause the hiking-cycle as ‘CPI inflation is expected to fall sharply from April.’
In turn, a dovish BoE rate-hike may drag on GBP/USD especially as the Federal Reserve forecasts a higher trajectory for US interest rates, but the recent pullback in the exchange rate may end up being short-lived if the central bank shows a greater willingness to pursue a more restrictive policy.
With that said, GBP/USD may face a larger pullback ahead of the BoE rate decision as it initiates a series of lower highs and lows, and the Relative Strength Index (RSI) may continue to show the bullish momentum abating as it moves away from overbought territory.
British Pound Price Chart – GBP/USD Daily

Chart Prepared by David Song, Strategist; GBP/USD on TradingView
- GBP/USD initiates a series of lower highs and lows after registering a fresh yearly high (1.2848) last week, and lack of momentum to hold above 1.2760 (61.8% Fibonacci retracement) may push the exchange rate towards 1.2650 (38.2% Fibonacci extension) as the Relative Strength Index (RSI) falls back from its highest reading for 2023.
- Developments in the RSI raises the scope for a near-term pullback in GBP/USD as the oscillator failed to push above 70, with a break/close below 1.2650 (38.2% Fibonacci extension) brining the 50-Day SMA (1.2508) on the radar.
- Nevertheless, the recent weakness in GBP/USD may end up being short-lived if the former-resistance zone around 1.2650 (38.2% Fibonacci extension) now acts as support, with a move above the monthly high (1.2848) opening up the 1.2890 (50% Fibonacci extension) to 1.2900 (23.6% Fibonacci retracement) region.
- Need a break/close above the 1.2890 (50% Fibonacci extension) to 1.2900 (23.6% Fibonacci retracement) region to bring the 1.3140 (61.8% Fibonacci extension) to 1.3210 (50% Fibonacci retracement) area on the radar, which incorporates the April 2022 high (1.3167).
Additional Market Outlooks
EUR/USD Post-ECB Rally Puts April High in Sight
Gold Price Pending Test of 50-Day SMA amid Bullish Outside Day
--- Written by David Song, Strategist
Follow on Twitter at @DavidJSong


