US Dollar Outlook: GBP/USD
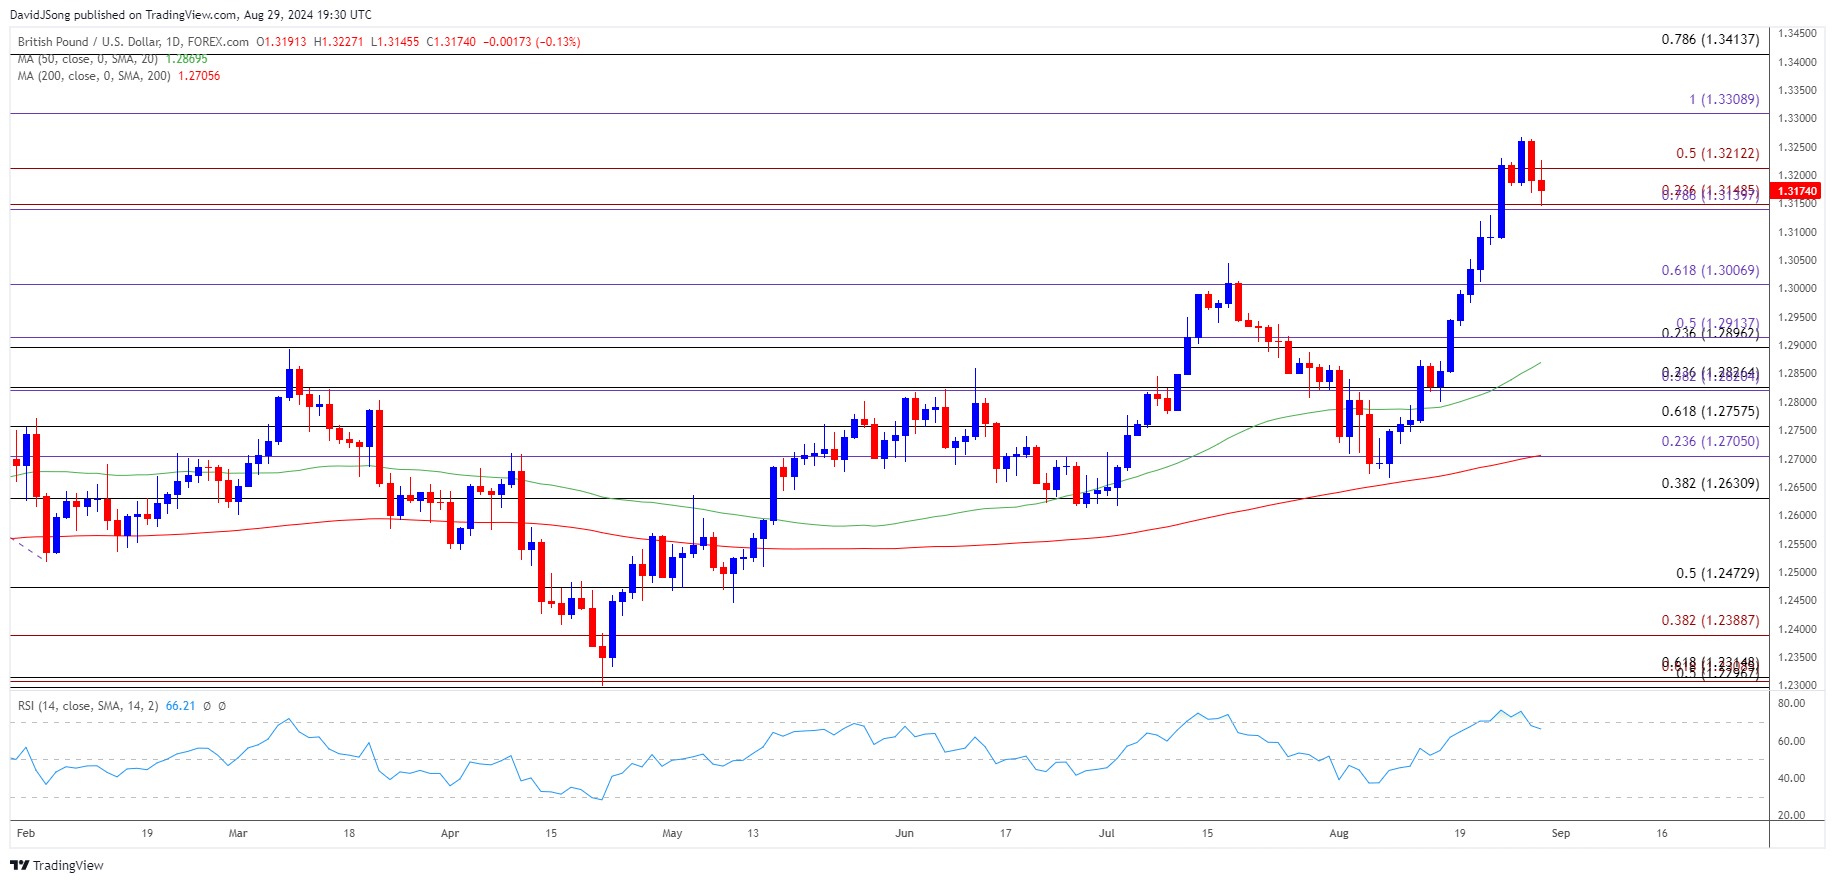
GBP/USD continues to pullback from a fresh yearly high (1.3267) to pull the Relative Strength Index (RSI) back from overbought territory, but the exchange rate may face range bound conditions over the remainder of the month should it continue to hold above the 2023 high (1.3143).
GBP/USD Pullback Brings RSI Back from Overbought Zone
GBP/USD initiates a series of lower highs and lows as it slips to a fresh weekly low (1.3146), and the exchange rate may continue to give back the advance from the monthly low (1.2665) as the RSI falls below 70 to indicate a sell-signal.
Join David Song for the Weekly Fundamental Market Outlook webinar. David provides a market overview and takes questions in real-time. Register Here
US Economic Calendar

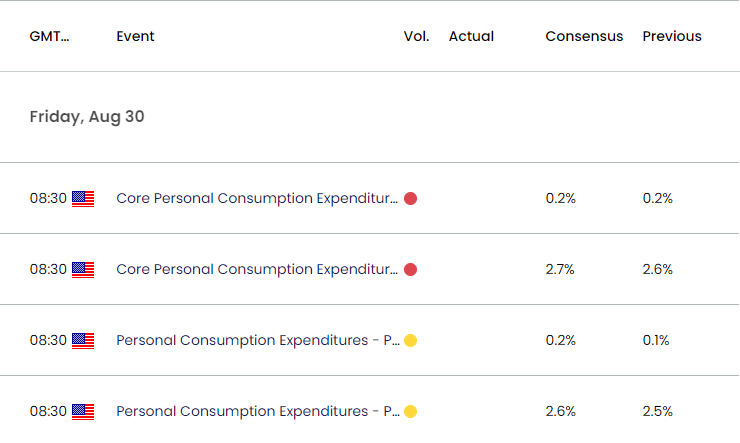
At the same time, data prints coming out of the US may sway GBP/USD as the Personal Consumption Expenditure (PCE) Price Index, the Federal Reserve’s preferred gauge for inflation, is anticipated to show sticky price growth.
The update may push the Federal Open Market Committee (FOMC) to further combat inflation as both the headline and core PCE are projected to increase in July, and the central bank may continue to forecast that ‘the appropriate level of the federal funds rate will be 5.1 percent at the end of this year’ as Chairman Jerome Powell and Co. are slated to update the Summary of Economic Projections (SEP) at its next quarterly meeting in September.
In turn, evidence of persistent inflation may spark a bullish reaction in the US Dollar as it limits the Fed’s scope to embark on a rate-cutting cycle, but a softer-than-expected PCE report may produce headwinds for the Greenback as encourages Fed officials to project a lower trajectory for US interest rates.
GBP/USD Price Chart –Daily

Chart Prepared by David Song, Strategist; GBP/USD on TradingView
- GBP/USD may extend the recent series of lower highs and lows as the Relative Strength Index (RSI) falls back from overbought territory, and a close below the 1.3140 (78.6% Fibonacci extension) to 1.3150 (23.6% Fibonacci extension) region may push the exchange rate back towards 1.3010 (61.8% Fibonacci extension).
- Next area of interest comes in around 1.2900 (23.6% Fibonacci retracement) to 1.2910 (50% Fibonacci extension) but GBP/USD may face range bound conditions over the remainder of the month if it continues to hold above the 2023 high (1.3143).
- Need a breach above the high (1.3267) to bring 1.3310 (100% Fibonacci extension) back on the radar, with the next region of interest coming in around 1.3410 (78.6% Fibonacci retracement).
Additional Market Outlooks
US Personal Consumption Expenditure (PCE) Preview (JUL 2024)
AUD/USD Vulnerable amid Struggle to Test January High
Euro Forecast: EUR/USD Preserves Advance Following Fed Symposium
USD/JPY Rebounds Ahead of Monthly Low to Keep RSI Above 30
--- Written by David Song, Strategist
Follow on Twitter at @DavidJSong


