Article Outline:
- Key Events: China, US Non-Farm Payrolls, US Dollar, Inflation Risks
- Technical Analysis: GBPUSD and XAUUSD (3-Day Time Frames)
- Technical Analysis (TA) Tip: Forecasting with Triangles
British Pound
The British pound faces continued pressure as the dollar strengthens, following the Bank of England’s (BOE) dovish rate hold in December and the Federal Reserve’s more hawkish than expected outlook for 2025. This, alongside the Trump effect, has pushed the pound toward 2024 lows as the year begins.
The UK economy remains exposed to inflation risks under Trump’s presidency, compounded by strengthening labor market conditions. With Trump’s term starting later this month, the dollar is maintaining a dominant edge in the markets. However, extreme conditions on currency charts between momentum and price in markets suggest potential reversals as the new administration takes office.
Gold
On the other hand, market ambiguity supports gold's upward momentum as a safe-haven asset. On one side, uncertainties surrounding inflation risks, trade wars, and geopolitical tensions are sustaining demand for the yellow metal. On the other side, the anticipated strength of the Chinese economy, known for its significant gold purchases during periods of growth, adds a positive edge to commodities, including oil markets. Once market clarity emerges, a notable correction in gold prices could follow. However, if uncertainty persists, gold may reach $3,000 per ounce in 2025.
Technical Analysis: Quantifying Uncertainties
GBPUSD Forecast: 3Day Time Frame – Log Scale

Source: Tradingview
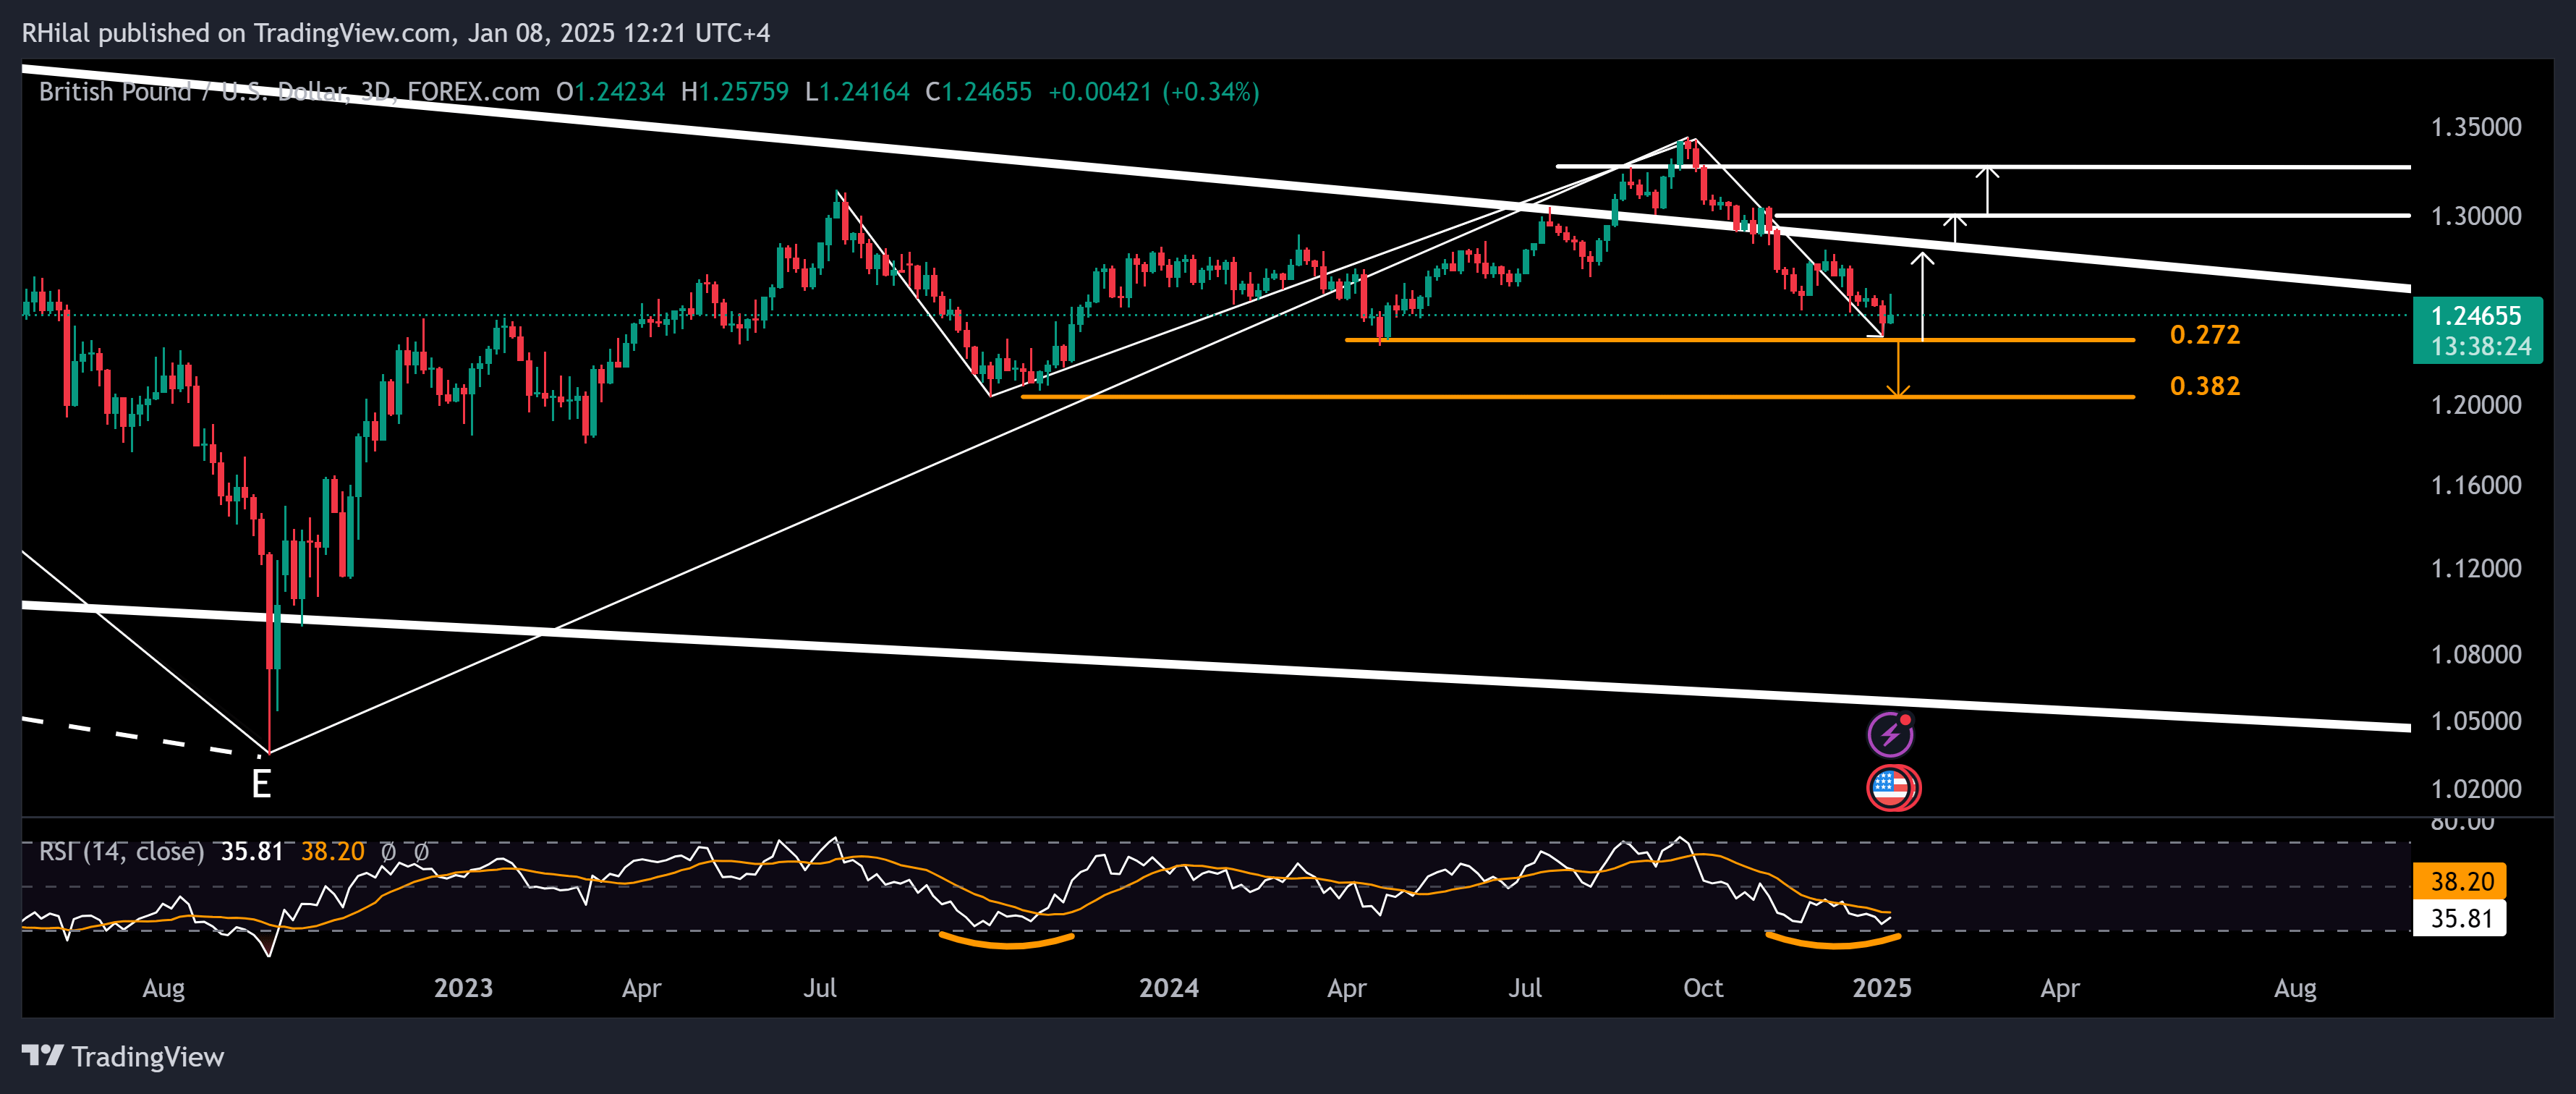
The GBP/USD is currently holding at a critical support level, with resistance targets at 1.28 and 1.30. Using the Fibonacci extension tool applied to the 2021 high, 2022 low, and 2024 high, the pair rebounded from the 0.272 Fibonacci support at 1.25. Additionally, the 3-day RSI is recovering from oversold levels, similar to those observed during the October 2023 lows.
Key indicators suggest a potential bullish reversal toward 1.28 and 1.30. However, a sustained close below 1.25 could trigger another bearish scenario, targeting the 1.20–1.19 support zone, aligning with the 0.382 Fibonacci extension ratio.
Gold Forecast: 3-Day Time Frame – Log Scale

Source: Tradingview
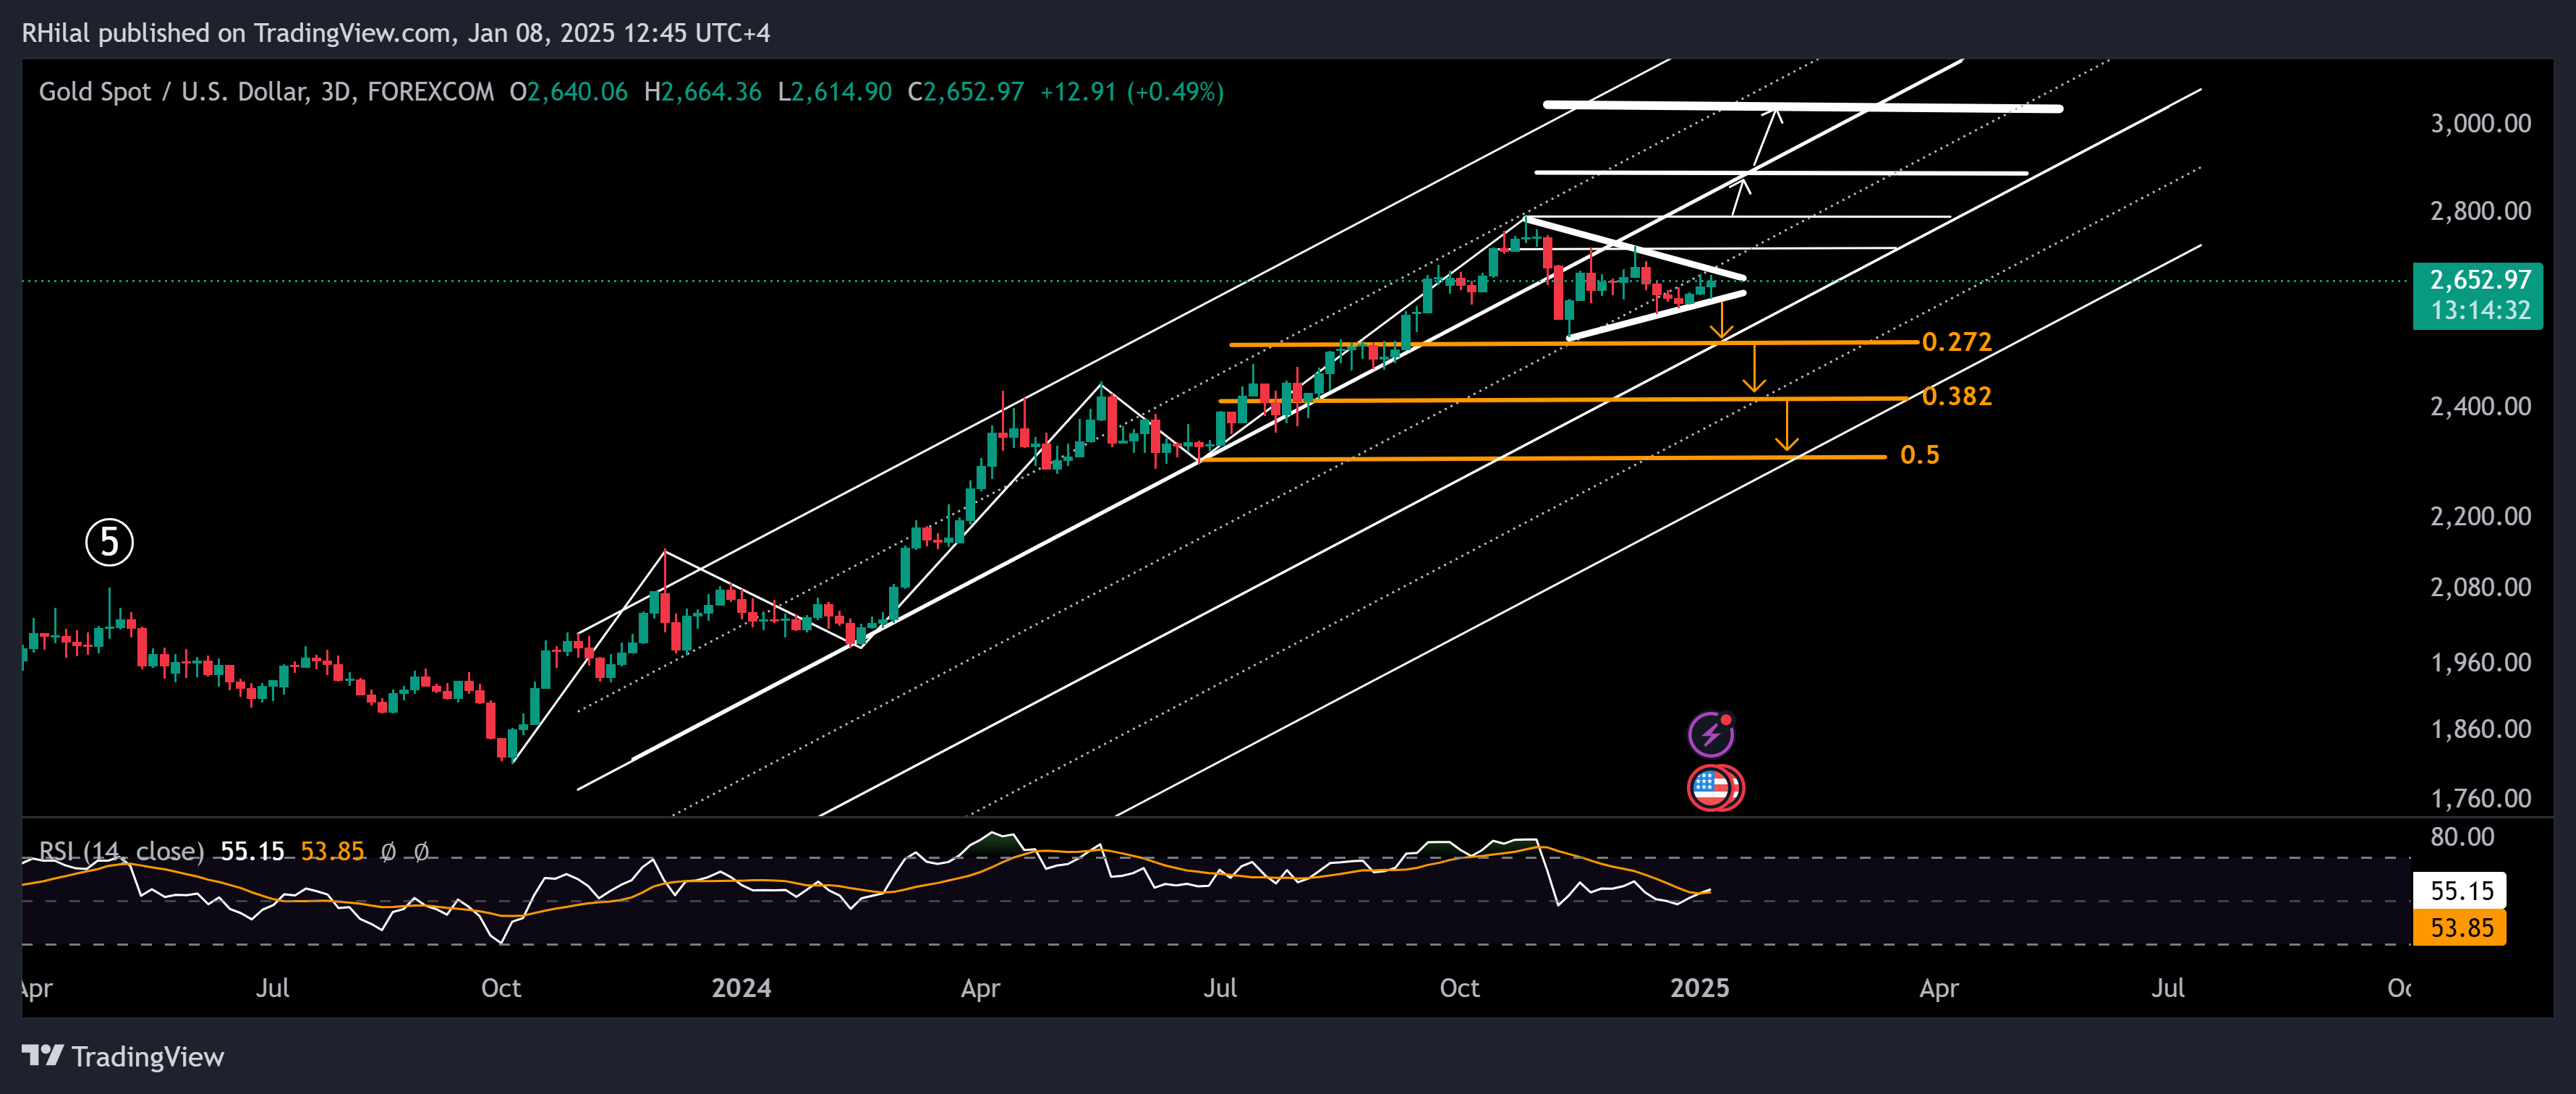
Gold concluded 2024 and began 2025 in a consolidation phase, forming a triangle pattern. By combining Fibonacci retracement levels, channel duplication, and triangle pattern targets, key technical insights emerge:
• A bearish breakout below the $2,520 low (0.272 Fibonacci retracement of the October 2023–2024 uptrend) and the lower boundary of the duplicated up-trending channel could lead to support levels at $2,420 and $2,300.
• The RSI is currently rebounding from the neutral 50 zone. Sustained momentum above 50, combined with a bullish breakout above $2,730, could drive gold toward $2,800, with further resistance at $2,890 and $3,050.
TA Tip: Forecasting with Triangles
Triangles are a common indicator of market indecision and can be analyzed using two techniques:
1. Projection of internal distance: Measure the internal height of the triangle and project it in the direction of the breakout.
2. Parallel channel extension: Extend a parallel channel from the triangle border opposite to the breakout direction to identify the next potential price levels.
NB: breakouts should be confirmed with momentum and volume indicators to avoid bull and bear traps
Written by Razan Hilal, CMT
Follow on X: @Rh_waves
You tube: Forex.com


