British Pound Outlook: GBP/USD
GBP/USD trades to a fresh monthly high (1.2290) as the US Dollar weakens against most of its major counterparts, and the update to the US Consumer Price Index (CPI) may fuel the recent rebound in the exchange rate as the report is anticipated to show slowing inflation.
GBP/USD Forecast: Test of Former Support Zone Looms
GBP/USD appears to be on track to test the former support zone around the May low (1.2308) as it reverses course ahead of the yearly low (1.1803), and the exchange rate may attempt to further retrace the decline from the September high (1.2713) after clearing the opening range for October.
Join David Song for the Weekly Fundamental Market Outlook webinar. David provides a market overview and takes questions in real-time. Register Here
Looking ahead, developments coming out of the US may sway GBP/USD as Federal Reserve Vice-Chair Philip Jefferson states that the central bank is ‘in a position to proceed carefully in assessing the extent of any additional policy firming that may be necessary,’ and signs of easing inflation may produce headwinds for the Greenback as it encourages the Federal Open Market Committee (FOMC) to retain the current policy.
US Economic Calendar

In turn, a downtick in both the headline and core CPI may generate a bearish reaction in the US Dollar as it fuels speculation of seeing US interest rates unchanged over the remainder of the year, but a stronger-than-expected inflation report may drag on GBP/USD as it puts pressure on the Fed to pursue a more a restrictive policy.
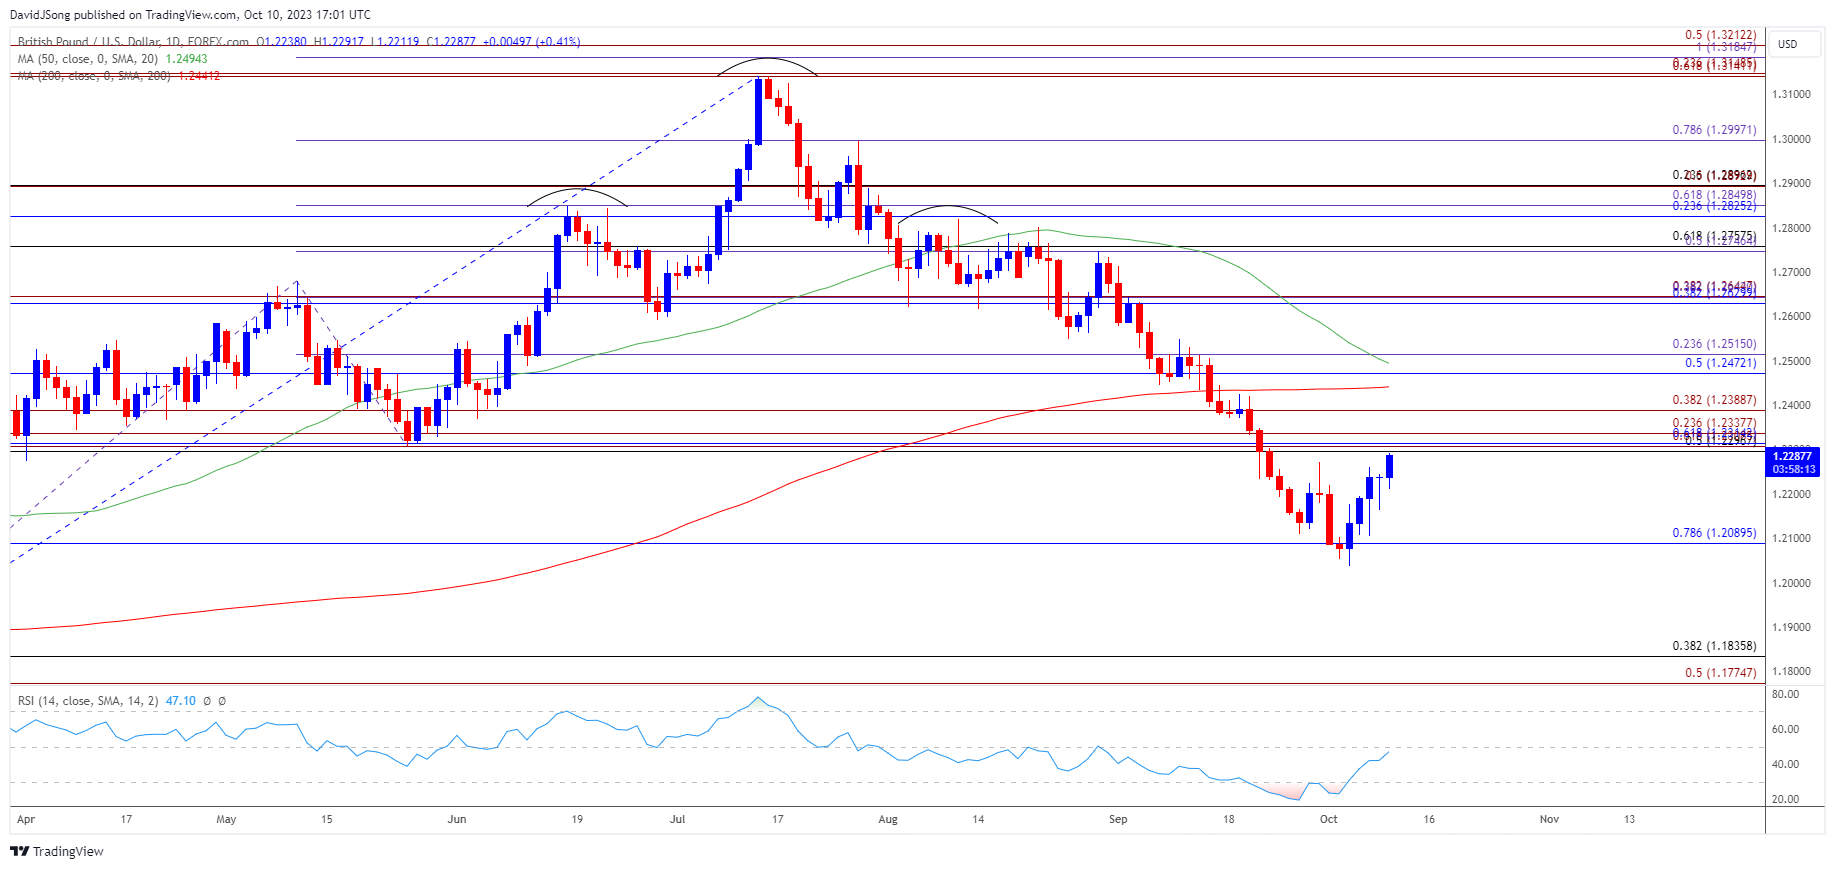
With that said, GBP/USD may attempt to further retrace the decline from the September high (1.2713) as it reverses ahead of the yearly low (1.1803), but the exchange rate may respond to the negative slope in the 50-Day SMA (1.2494) if it fails to push back above the former support zone around the May low (1.2308).
GBP/USD Price Chart –Daily

Chart Prepared by David Song, Strategist; GBP/USD on TradingView
- GBP/USD bounced back ahead of the yearly low (1.2308) to clear the opening range for October, and the exchange rate may attempt to test the former support zone around the May low (1.2308) as it climbs to a fresh monthly high (1.2290).
- A break/close above the 1.2300 (50% Fibonacci retracement) to 1.2390 (38.2% Fibonacci extension) region brings the 1.2470 (50% Fibonacci retracement) to 1.2520 (23.6% Fibonacci extension) area back on the radar, but GBP/USD may respond to the negative slope in the 50-Day SMA (1.2494) if it fails to trade back above the former support zone around the May low (1.2308).
- Lack of momentum to break/close above the 1.2300 (50% Fibonacci retracement) to 1.2390 (38.2% Fibonacci extension) region may push GBP/USD back towards 1.2090 (78.6% Fibonacci retracement), with a breach below the monthly low (1.2037) bringing the yearly low (1.1803) back on the radar.
Additional Market Outlooks
AUD/USD Outlook Hinges on Reaction to Negative Slope in 50-Day SMA
US Dollar Forecast: EUR/USD Rebound Emerges Ahead of December 2022 Low
--- Written by David Song, Strategist
Follow on Twitter at @DavidJSong


