British Pound Outlook: GBP/USD
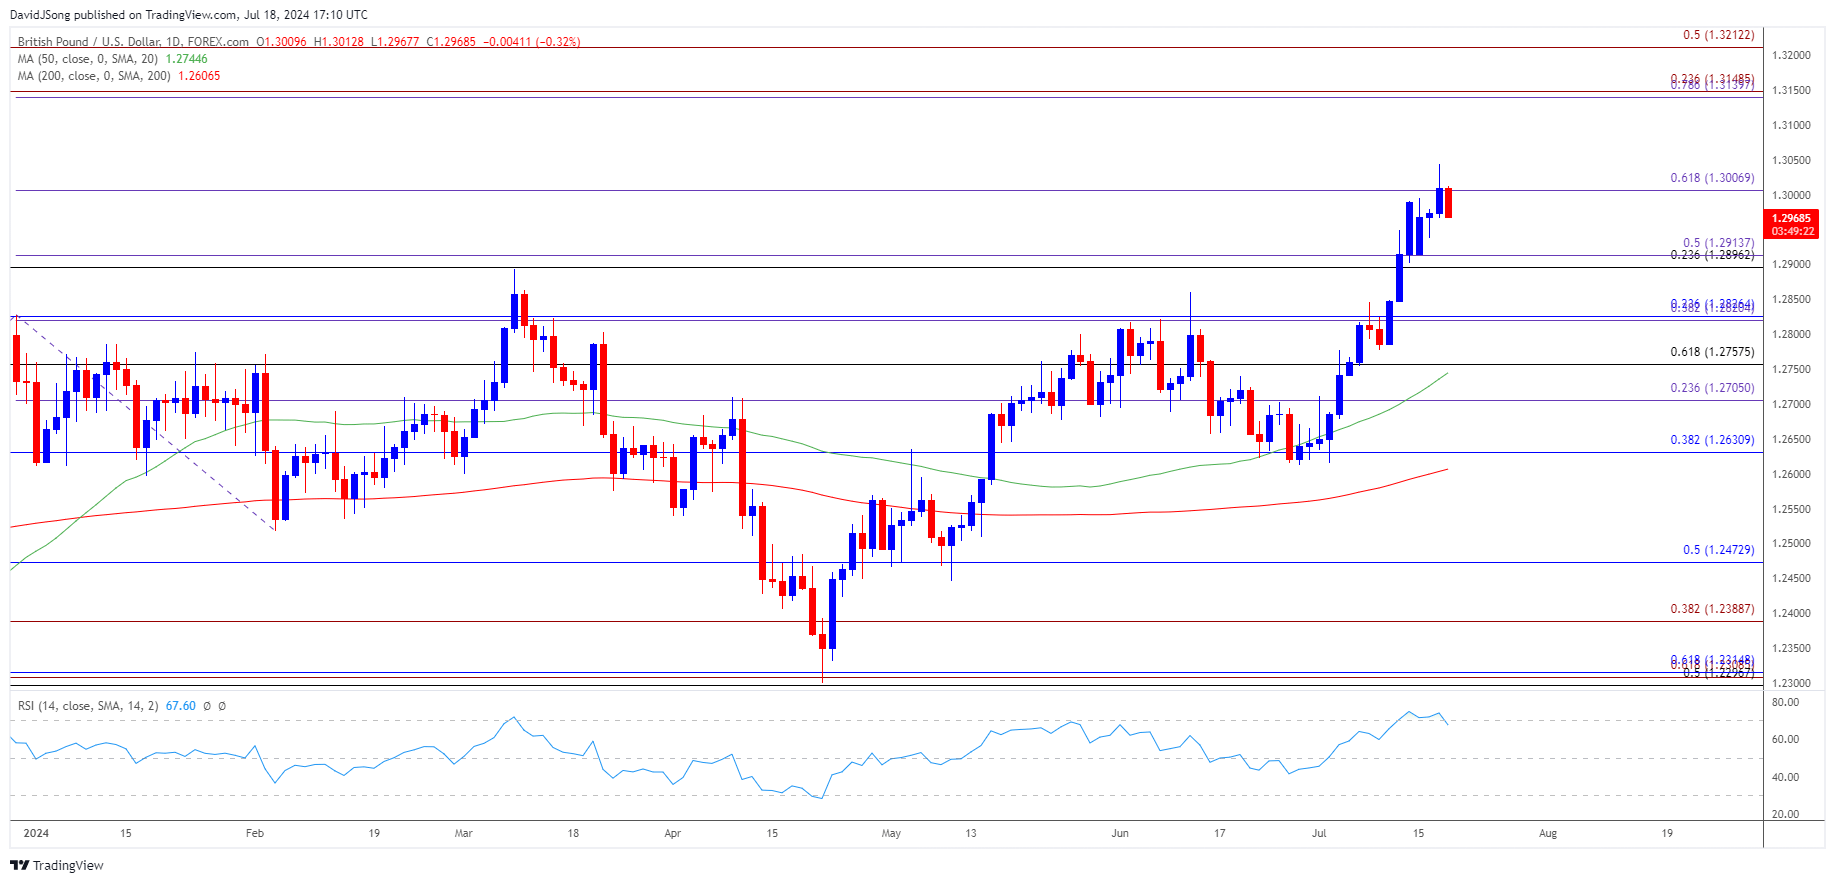
GBP/USD falls from a fresh yearly high (1.3045) to pull the Relative Strength Index (RSI) below 70, and the oscillator may continue to show the bullish momentum abating as moves away from overbought territory.
GBP/USD Forecast: RSI Falls Back from Overbought Zone
Keep in mind, the broader outlook for GBP/USD remains constructive amid the break above the March high (1.2894), and the exchange rate may develop a bullish trend as the 50-Day SMA (1.2745) now reflects a positive slope.
Join David Song for the Weekly Fundamental Market Outlook webinar. David provides a market overview and takes questions in real-time. Register Here
However, GBP/USD seems to be carving a bearish inside-day candle as it struggles to retain the advance following the UK Consumer Price Index (CPI), and it remains to be seen if the Bank of England (BoE) will further combat inflation amid the 7 to 2 split within the Monetary Policy Committee (MPC).
UK Economic Calendar

The update to the UK Retail Sales report may lead to a larger dissent within the BoE as household spending is expected to contract 0.4% in June, and signs of slowing economy may lead to a larger pullback in GBP/USD as it fuels speculation for a looming change in regime.
However, a better-than-expected Retail Sales report may encourage the majority of the BoE to retain a restrictive policy, and a positive development may curb the recent weakness in GBP/USD as it raises the central bank’s scope to keep UK interest rates higher for longer.
With that said, GBP/USD may attempt to further retrace the decline from the 2023 high (1.3143) should it track the positive slope in the 50-Day SMA (1.2745), but the exchange rate may face a larger pullback as the Relative Strength Index (RSI) falls back from overbought territory to indicate a sell-signal.
GBP/USD Price Chart –Daily

Chart Prepared by David Song, Strategist; GBP/USD on TradingView
- GBP/USD cleared the March high (1.2894) to register a fresh yearly high (1.3045) but lack of momentum to hold above 1.3010 (61.8% Fibonacci extension) may lead to a larger pullback in the exchange rate as the Relative Strength Index (RSI) comes off of overbought territory.
- A break/close below the 1.2900 (23.6% Fibonacci retracement) to 1.2910 (50% Fibonacci extension) region may push GBP/USD towards the 1.2760 (61.8% Fibonacci retracement) to 1.2830 (23.6% Fibonacci retracement) zone, but the exchange rate may exhibit a bullish trend as the 50-Day SMA (1.2745) now reflects a positive slope.
- A break above the monthly high (1.3045) brings the 1.3140 (78.6% Fibonacci extension) to 1.3150 (23.6% Fibonacci extension) area back on the radar, which incorporates the 2023 high (1.3143), with the next region of interest coming in around 1.3210 (50% Fibonacci extension).
Additional Market Outlooks
Australian Dollar Forecast: AUD/USD Reverses Ahead of January High
US Dollar Forecast: USD/JPY Fails to Close Below 50-Day SMA
--- Written by David Song, Strategist
Follow on Twitter at @DavidJSong


