British Pound Outlook: GBP/USD
GBP/USD extends the decline following the Federal Reserve rate decision as the Bank of England (BoE) unexpectedly keeps the Bank Rate at 5.25% in September.
GBP/USD Falls After BoE Rate Decision to Push RSI Into Oversold Zone
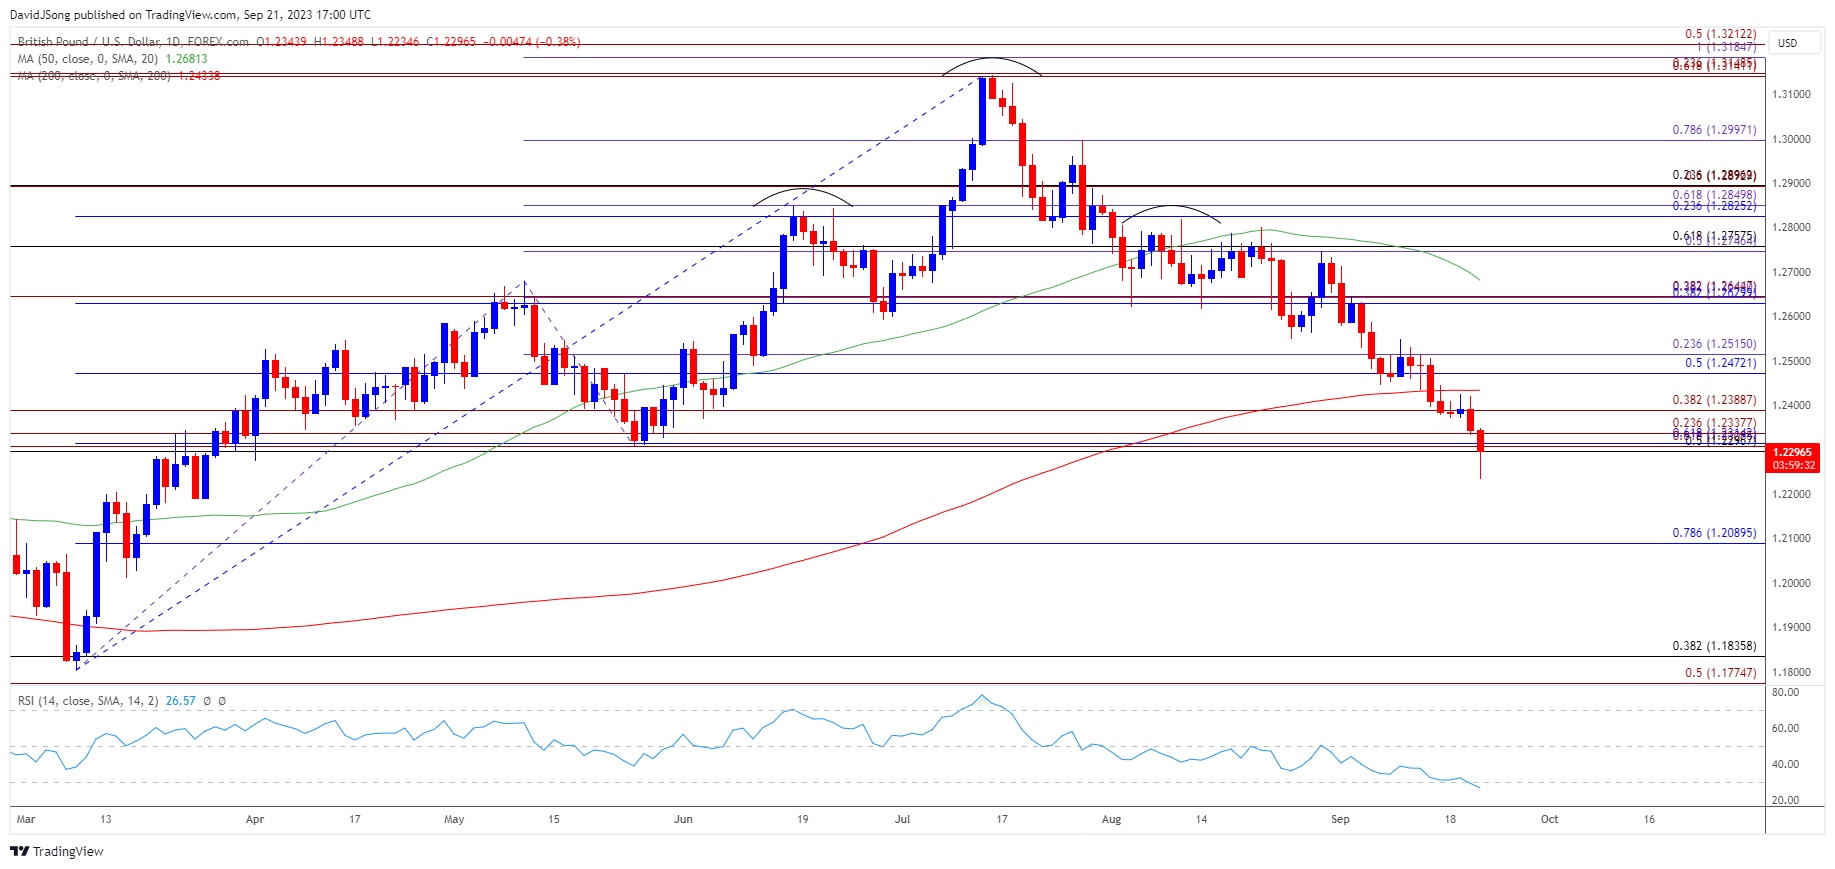
Keep in mind, GBP/USD trades below the 200-Day SMA (1.2434) for the first time since March as a head-and-shoulders pattern started to unfold earlier this month, with the breach below the May low (1.2308) pushing the Relative Strength Index (RSI) into oversold territory for the first time in 2023.
Recent developments surrounding GBP/USD suggest there’s a change in trend as the 50-Day SMA (1.2681) now reflects a negative slope, and the British Pound may face headwinds over the remainder of the month as the BoE appears to be at or nearing the end of its hiking-cycle.
The 5-4 split within the Monetary Policy Committee (MPC) comes as the ‘Bank staff now expected GDP to rise only slightly in 2023 Q3,’ and signs of a slowing economy may lead to a greater dissent within the central bank as ‘underlying growth in the second half of 2023 was also likely to be weaker than had been expected.’
Join David Song for the Weekly Fundamental Market Outlook webinar. David provides a market overview and takes questions in real-time. Register Here
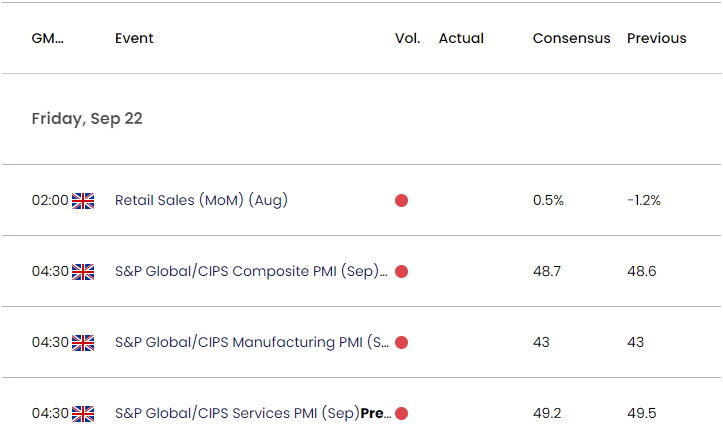
UK Economic Calendar

As a result, looming data prints coming out of the UK may sway GBP/USD as Retail Sales is expected to rebound 0.5% in August, while the Purchasing Managers Index (PMI) for both manufacturing and a services are projected to decline in September.
A batch of mixed developments may do little to prop up GBP/USD as the majority of the BoE vote for a wait-and-see approach, and it remains to be seen if Governor Andrew Bailey and Co. will continue to adjust the forward guidance over the remainder of the year as ‘there were signs that the labour market was loosening.’
With that said, the head-and-shoulders patten may continue unfold as GBP/USD takes out the May low (1.2308), and the exchange rate may exhibit a bearish trend as the 50-Day SMA (1.2681) now reflects a negative slope.
GBP/USD Price Chart –Daily

Chart Prepared by David Song, Strategist; GBP/USD on TradingView
- GBP/USD trades to a fresh monthly low (1.2235) following the failed attempt to push back above the 200-Day SMA (1.2434), with the weakness in the exchange rate pushing the Relative Strength Index (RSI) into oversold territory for the first time this year.
- The move below 30 in the RSI is likely to be accompanied by a further decline in GBP/USD like the price action from last year, and failure to hold above the 1.2300 (50% Fibonacci retracement) to 1.2390 (38.2% Fibonacci extension) region may push GBP/USD towards 1.2090 (78.6% Fibonacci retracement).
- Next area of interest comes in around 1.1780 (50% Fibonacci extension) to 1.1840 (38.2% Fibonacci retracement), which incorporates the March low (1.1803), but lack of momentum to close below the 1.2300 (50% Fibonacci retracement) to 1.2390 (38.2% Fibonacci extension) region may pull the RSI out of oversold territory.
- Need a move above the 200-Day SMA (1.2434) to bring the 1.2470 (50% Fibonacci retracement) to 1.2520 (23.6% Fibonacci extension) zone back on the radar, with the next area of interest coming in around 1.2630 (38.2% Fibonacci extension) to 1.2650 (38.2% Fibonacci extension).
Additional Market Outlooks
Euro Forecast: Post-Fed EUR/USD Selloff Eyes Monthly Low
AUD/USD Forecast: Fed Interest Rate Decision in Focus
--- Written by David Song, Strategist
Follow on Twitter at @DavidJSong


