US Dollar Outlook: GBP/USD
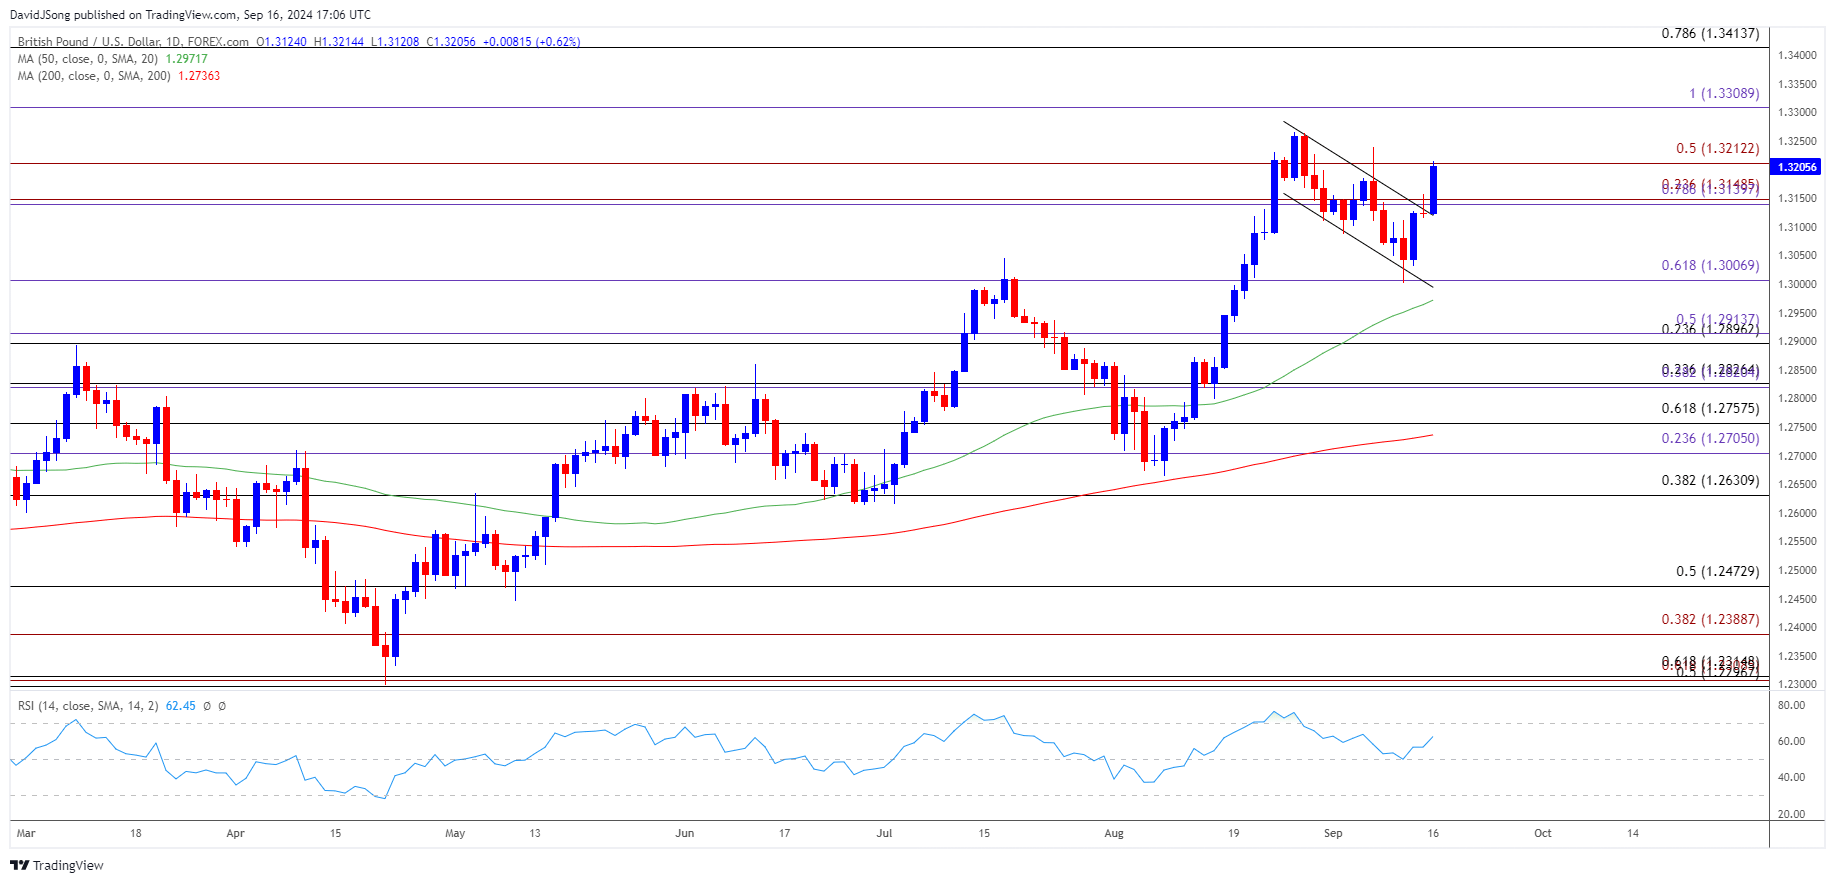
GBP/USD may attempt to retrace the decline from the yearly high (1.3267) as a bull-flag formation appears to be unfolding.
GBP/USD Bull-Flag Starts to Unfold Ahead of Fed and BoE Rate Decision
GBP/USD approaches the monthly high (1.3239) as it extends the series of higher highs and lows from last week, and the exchange rate may track the positive slope in the 50-Day SMA (1.2972) as it bounces back ahead of the moving average.
Join David Song for the Weekly Fundamental Market Outlook webinar. David provides a market overview and takes questions in real-time. Register Here
Looking ahead, the Federal Reserve interest rate decision may sway GBP/USD as the central bank is expected to alter the course for US monetary policy, with the central bank widely anticipated to deliver at least a 25bp rate-cut.
US Economic Calendar

At the same time, the Fed is slated to release the updated Summary of Economic Projections (SEP), and it remains to be seen if the Federal Open Market Committee (FOMC) will adjust its forward guidance as the dot-plot from the June meeting showed that ‘the appropriate level of the federal funds rate will be 5.1 percent at the end of this year.’
As a result, the US Dollar may face headwinds following a shift in Fed policy should the fresh forecasts from Chairman Jerome Powell and Co. reflect a lower trajectory for US interest rates, but more of the same from Fed officials may generate a bullish reaction in the Greenback as the central bank tames speculation for a rate-cutting cycle.
UK Economic Calendar

In turn, GBP/USD may face increased volatility going into the Bank of England (BoE) meeting even though Governor Andrew Bailey and Co. are expected to keep UK interest rates on hold, and the BoE rate decision may spur a limited reaction in the exchange rate as the central bank moves to the sidelines.
With that said, GBP/USD may negate the continuation patter if it struggles to retrace the decline from the yearly high (1.3267), but the exchange rate may track the positive slope in the 50-Day SMA (1.2972) as it extends the bullish price series from last week.
GBP/USD Price Chart –Daily

Chart Prepared by David Song, Strategist; GBP/USD on TradingView
- GBP/USD seems to have reversed ahead of the 50-Day SMA (1.2972) as it extends the rebound from the monthly low (1.3002), with a breach above the monthly high (1.3239) bringing the yearly high (1.3267) on the radar.
- Next area of interest comes in around 1.3310 (100% Fibonacci extension) followed by 1.3410 (78.6% Fibonacci retracement), and the Relative Strength Index (RSI) may show the bullish momentum gathering pace as it approaches overbought territory.
- A move above 70 in the RSI is likely to be accompanied by a further advance in GBP/USD like the price action from last month but lack of momentum to close above 1.3210 (50% Fibonacci extension) may keep the exchange rate within last month’s range.
- Failure to hold above the 1.3140 (78.6% Fibonacci extension) to 1.3150 (23.6% Fibonacci extension) region may push GBP/USD back towards the monthly low (1.3002), with a break/close below 1.3000 (61.8% Fibonacci extension) bringing the 1.2900 (23.6% Fibonacci retracement) to 1.2910 (50% Fibonacci extension) area back on the radar.
Additional Market Outlooks
US Retail Sales Report Preview (AUG 2024)
Gold Price Breakout Pushes RSI Toward Overbought Zone
US Dollar Forecast: USD/JPY Rebounds Ahead of December Low
US Dollar Forecast: USD/CAD Pushes Above September Opening Range
--- Written by David Song, Strategist
Follow on Twitter at @DavidJSong


