British Pound, GBP Talking Points:
- The GBP/USD pair broke out to a fresh 10-month high this morning, continuing a topside break from a bull flag formation.
- Next week sees UK data come in the spotlight, with the release of employment numbers next Tuesday and then CPI on Wednesday, with expectation for headline CPI to print at 9.9% after last month’s 10.4% read.
- I’ll be discussing these themes in-depth in the weekly webinar on Tuesday at 1PM ET. It’s free for all to register: Click here to register.
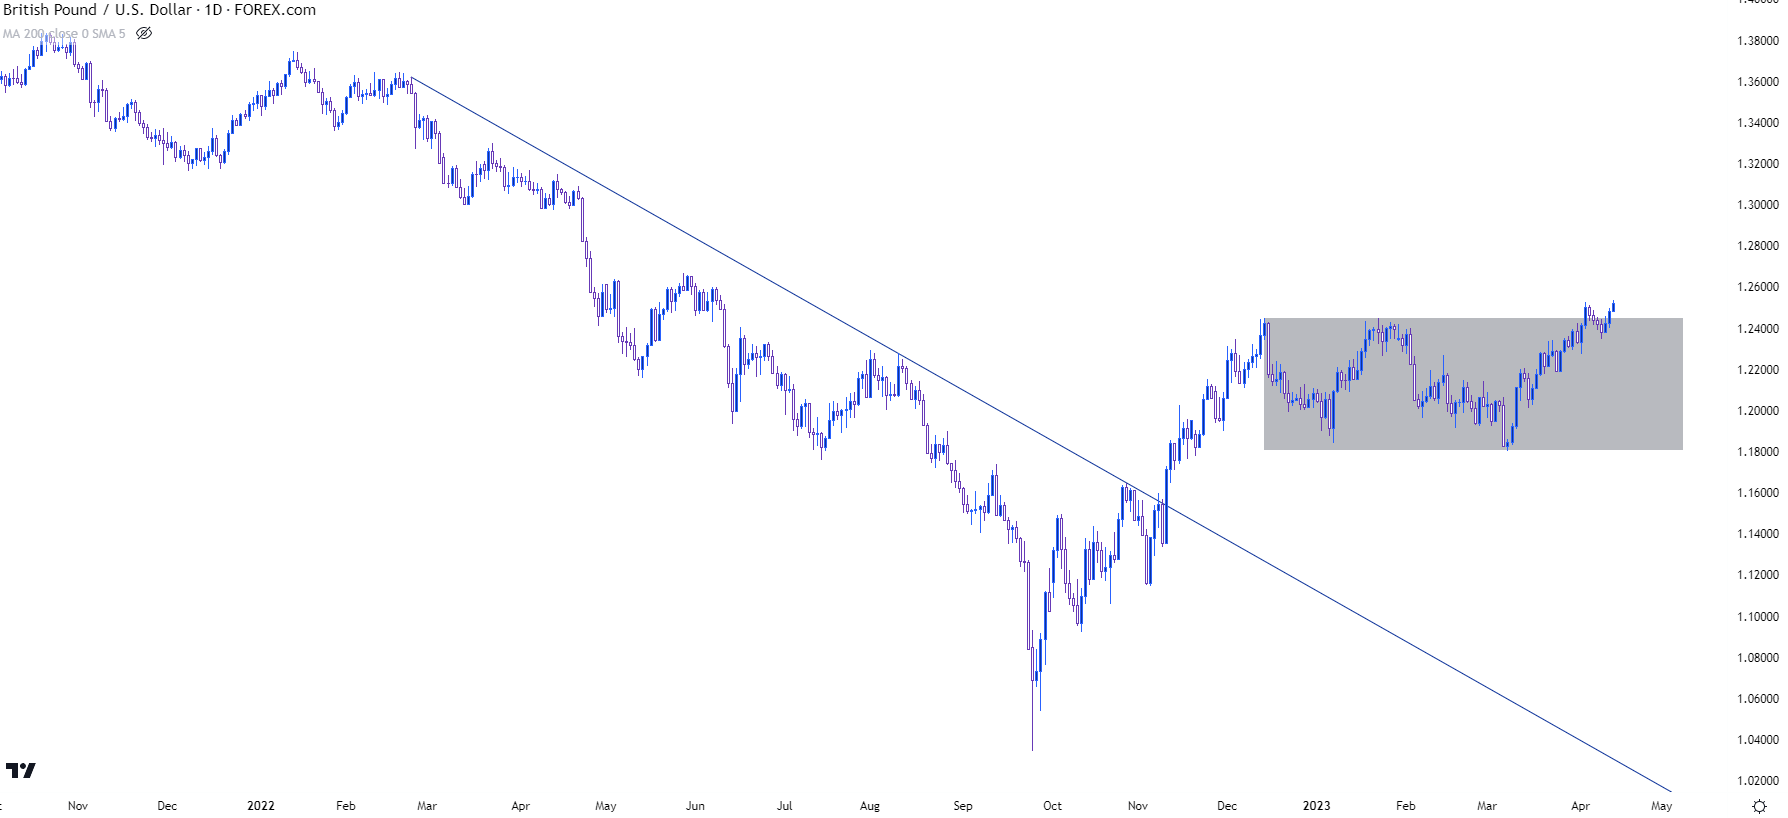
GBP/USD is breaking out up to a fresh 10-month high today, trading above a bull flag formation that had built along the way.
Last week saw GBP/USD touch the 1.2500 level for the first time since the pair fell-below in June of last year. Of course, a few months later, GBP/USD put in that collapse-like move after the unveil of the UK budget, which led to a strong pullback in Q4 that largely remained in a range-bound state through much of Q1.
GBP/USD Daily Chart

Chart prepared by James Stanley, GBP/USD on Tradingview
The top-end of that range was around 1.2444, which had come into play twice ahead of last week’s test: In December and then again in January. Last week’s initial test above that price, with eventually pushed up to 1.2500, was met with pullback down to the 1.2362 level which as looked at in this week’s US Dollar Price Action Setups. But bears couldn’t break much fresh ground below that price with the Monday low coming in at 1.2344 – and that’s when bulls came into the matter with a newfound sense of aggression.
That low on Monday helped to establish the support side of a bearish channel, which when matched with the prior bullish trend made for a bull flag formation.
GBP/USD Four-Hour Price Chart

Chart prepared by James Stanley, GBP/USD on Tradingview
GBP/USD Bullish Breakout
After the Monday low price quickly pushed up for a resistance test on Tuesday, as the topside of the channel was confluent with the familiar 1.2444 level at the time. That held the highs into Wednesday trade, after which another falling CPI data print out of the U.S. helped to prod USD weakness and GBP/USD strength, which led to a strong push of continuation that’s held through this morning’s trade to allow for fresh 10-month highs to come into the picture.
From shorter-term charts, there’s even been a show of support at that 1.2500 spot, which as of this writing, has held the lows; but it does bring to question continuation potential after a really strong move had already developed this week.
GBP/USD Two-Hour Price Chart

Chart prepared by James Stanley, GBP/USD on Tradingview
GBP/USD Moving Forward
The big question behind continuation scenarios in the GBP/USD breakout is whether the US Dollar can churn down to a fresh low in DXY, and how next week’s data rolls out for the UK. While this morning’s PPI report showed continued softening in inflationary pressure in the US, echoing the headline CPI read from yesterday, UK inflation is in a far different place at the moment after last month’s 10.4% read for headline CPI. While the current CPI high for this cycle was at 11.1% in November, the fact that this data point increased last month after a brief fall below 10% is at least somewhat discouraging for the Bank of England as their fight with inflation still has a way to go.
For bullish trend strategies, the 1.2500 level sticks out but the fact that it’s already been tested for support today should be considered. Below that, 1.2470 is of interest for possible support, after which the familiar 1.2444 level comes back into the equation. This was a big area of long-term resistance that started to show as short-term support last week. But since the recent breakout there hasn’t been a support test there. After that level, it’s the 1.2398 price, and a breach of that can begin to bring question to bullish continuation scenarios.
UK Headline CPI Since January 2021

Chart prepared by James Stanley
--- written by James Stanley, Senior Strategist


